Kubernetes Monitoring: An Introduction

One of the first things you’ll learn when you start managing application performance in Kubernetes is that doing so is, in a word, complicated. No matter how well you’ve mastered performance monitoring for conventional applications, it’s easy to find yourself lost inside a Kubernetes cluster.
Not only are there more layers to monitor in the context of Kubernetes, but simply getting at the data you need can be a lot more challenging as well, given the way application data is hidden within Kubernetes clusters.
To help you get started with Kubernetes performance management, this article offers an overview of which metrics you’ll want to monitor and how to collect them. We won’t walk through every aspect of Kubernetes application performance management because that would require much more than a blog post, but we’ll cover the essentials that you’ll need to know in order to begin building an application performance monitoring strategy for Kubernetes.
What is Kubernetes?
As organizations are adopting microservices architecture to gain speed, resilience, and scalability, they are increasingly adopting containers to package, distribute and run distributed microservices.
Kubernetes has emerged as the de facto standard for container orchestration. With over 51K stars on GitHub and 2,100 contributors spanning every time zone across the globe, Kubernetes enjoys a vibrant community. According to a survey by Cloud Native Computing Foundation (CNCF), Kubernetes adoption has been consistently increasing and 83% of respondents cite Kubernetes as their choice for container management.
Kubernetes Application Monitoring vs. Kubernetes Monitoring
A basic concept that you need to understand before going further is that there are two different types of performance monitoring that you will want to perform in a Kubernetes environment.
The first involves monitoring the applications that run in your Kubernetes cluster in the form of containers or pods (which are collections of interrelated containers).
The second is monitoring the performance of Kubernetes itself, meaning the various components – like the API server, Kubelet, and so on – that make up Kubernetes. The metrics you’ll want to watch for keeping your Kubernetes cluster itself healthy (and the way you access those metrics) are different from those that matter when monitoring the performance of individual applications (and are fodder for a future blog post).
You could think of the differences here as being akin to the differences between monitoring the performance of an operating system on a conventional server and monitoring an application running on that server. In the case of Kubernetes, Kubernetes is the operating system, and the containers or pods deployed on it are the application. Obviously, the performance of Kubernetes itself impacts the performance of your applications, but each layer of the environment exposes different types of metrics and stores them in different ways.
Metrics for Kubernetes Application Performance Monitoring
If this sounds a bit confusing, the good news is that the actual metrics you’ll want to collect for application performance monitoring in Kubernetes are generally the same as those you’d collect in a conventional environment.
Those metrics will vary depending on which applications you’re managing, but they’ll generally include data such as:
- Request rate.
- Response time.
- Error rate.
- Memory usage.
- CPU usage.
- Persistent storage usage.
Usually, applications running in Kubernetes expose these performance metrics either in log files or by printing them to standard output and standard error streams, just as they would if they were running on a standard server instead of in Kubernetes.
Easy peasy, right?
How Kubernetes Handles Application Metrics and Logs
Well, not quite. Matters get more complicated when you get into actually collecting application performance metrics in Kubernetes.
The big difference between Kubernetes and a conventional server is that, in Kubernetes, data that pods and containers write to their internal file systems is not stored persistently when the pods or containers shut down. It disappears permanently, unless you collect it and move it somewhere else first.
What’s more, pods and containers don’t write monitoring data to a single location in your Kubernetes cluster. Each pod or container will store its log and events data in a different location (usually, within the internal file systems of its containers). That means that Kubernetes doesn’t provide you with a way of aggregating or querying monitoring data from all of your applications using a single interface or command.
In other words, you can’t simply do something like “tail /var/log/syslog” in Kubernetes and get all relevant application data.
How to Collect Kubernetes Application Data
Fortunately, it’s still quite possible to collect application metrics and log data in Kubernetes. You just need to work a little harder than you would in a conventional server environment.
There are two main ways to get application monitoring data from Kubernetes. One is to deploy a logging agent on the nodes within your Kubernetes cluster. The nodes are the individual servers that host your containers. When containers write monitoring data to their internal file systems, a logging agent running on the node can pull that data out, then forward it to an external monitoring tool. There, the data will persist for as long as you want it to, even if the container or pod shuts down.
The other approach is to run what’s known in Kubernetes speak as a “sidecar” container that hosts a logging agent. Under this technique, the sidecar container runs alongside the other containers you want to monitor within the same pod and collects monitoring data from them. It then forwards the monitoring data to an external logging and monitoring system.
A third solution is to build logic into your applications themselves that exports their monitoring data directly to an external logging system. Because this requires changes to the applications, however, it’s a less commonly used technique than the other two.
What about Kubernetes Cluster Monitoring?
Again, to manage all aspects of application performance, you’ll also want to monitor the performance of your Kubernetes clusters themselves and correlate that data with data from individual applications. That’s the only way to know whether an application that is responding slowly due to a lack of available memory has an internal memory leak, for example, or if it’s suffering from a lack of resources at the cluster level.
Understanding Kubernetes Objects
Kubernetes is a system that assembles a group of machines into a single unit that can be consumed via an API. Kubernetes further segments those compute resources into two groups: Worker Nodes, and Master Node(s).
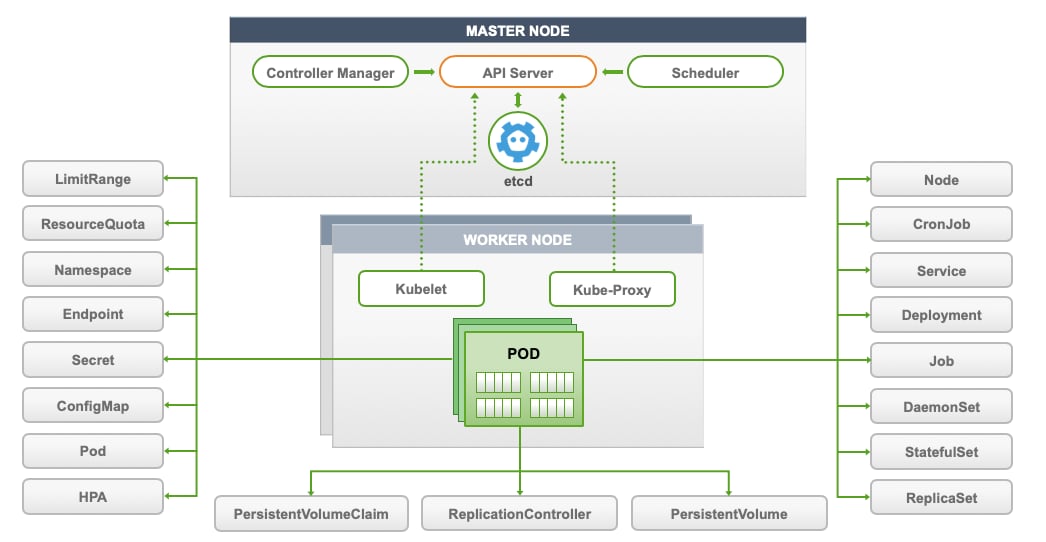
Kubernetes consists of persistent entities called Kubernetes Objects which represent the state of Kubernetes cluster. These objects include:
- Containerized applications that are deployed on the cluster and associated nodes
- The resources available to those applications
- The policies around how those applications behave, such as restart policies, upgrades, and fault-tolerance
Monitoring in Kubernetes Environments
The biannual CNCF survey cites monitoring as one of the top challenges in successfully adopting Kubernetes. However, traditional monitoring tools are unsuitable for measuring the health of cloud-native applications and infrastructure. As Gartner notes:
"Historically, monitoring tools have focused on host-level metrics, such as CPU utilization, memory utilization, input-output (I/O) per second, latency and network bandwidth. Although these metrics are still important for operations teams, by themselves they won’t paint a full picture, because they lack granular detail at the container or service level."
The monitoring strategies of yore do not work in the cloud-native era primarily because:
There Are More Components to Monitor
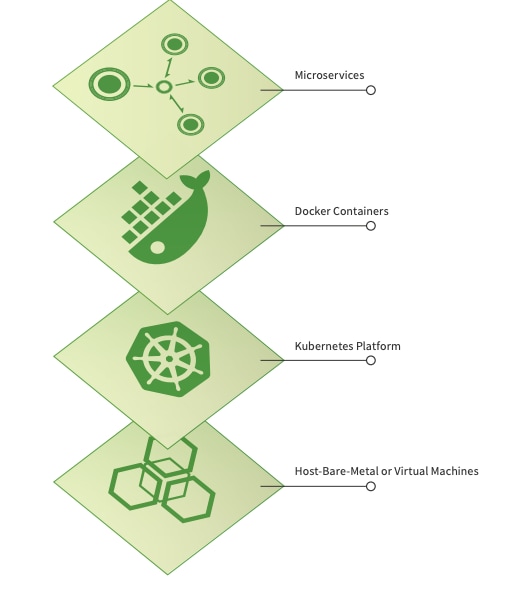
In the monolithic world, there are only two components to monitor — applications and the hosts on which the applications were deployed. In the cloud-native world, containerized applications orchestrated by Kubernetes have multiple components that require monitoring:
- Hosts
- The Kubernetes platform itself
- Docker containers
- Containerized microservices
Container Ephemerality and Unpredictable Pod Placement
Unlike the traditional long-running host model, modern microservices-based applications are typically deployed on containers which are dynamic and ephemeral. Kubernetes ensures that the desired number of application replicas are running. Kubernetes will place the pods on whichever nodes it deems fit, unless specifically instructed not to do so via node affinity or taints. In fact, letting Kubernetes schedule pods is the key design goal for this self-adjusting system.
Traditional monitoring approaches do not work in these highly-dynamic environments because they typically follow long-running hosts using host names or IP addresses. For containerized environments, monitoring tools must provide immediate service discovery and automatically detect the lifecycle events of containers, while also adjusting metric collection as containers are spun up or restarted in seconds
Monitoring the Performance of Microservices
Pinpointing issues in a microservices environment is more challenging than with a monolithic one, as requests traverse both between different layers of the stack and across multiple services. Modern monitoring tools must monitor these interrelated layers while also efficiently correlating application and infrastructure behavior to streamline troubleshooting
Open-Source Options for Monitoring Kubernetes
DevOps teams typically first start with the built-in monitoring options that come with a standard Kubernetes deployment. These options include:
- Kubernetes health checks with probes
- cAdvisor
- Metrics API and Metrics Server
- The Kubernetes Dashboard
- Kube-state-metrics
- Prometheus metrics
Probes
Using Kubernetes Liveness probe, Kubernetes will execute a liveness command within the pod with a predefined frequency. Below is a simple example from Kubernetes docs of liveness probe by running cat command.
While probes provide simplistic checks at a moment of time, they lack sophisticated performance analytics capabilities as well as persistence for historical trends.
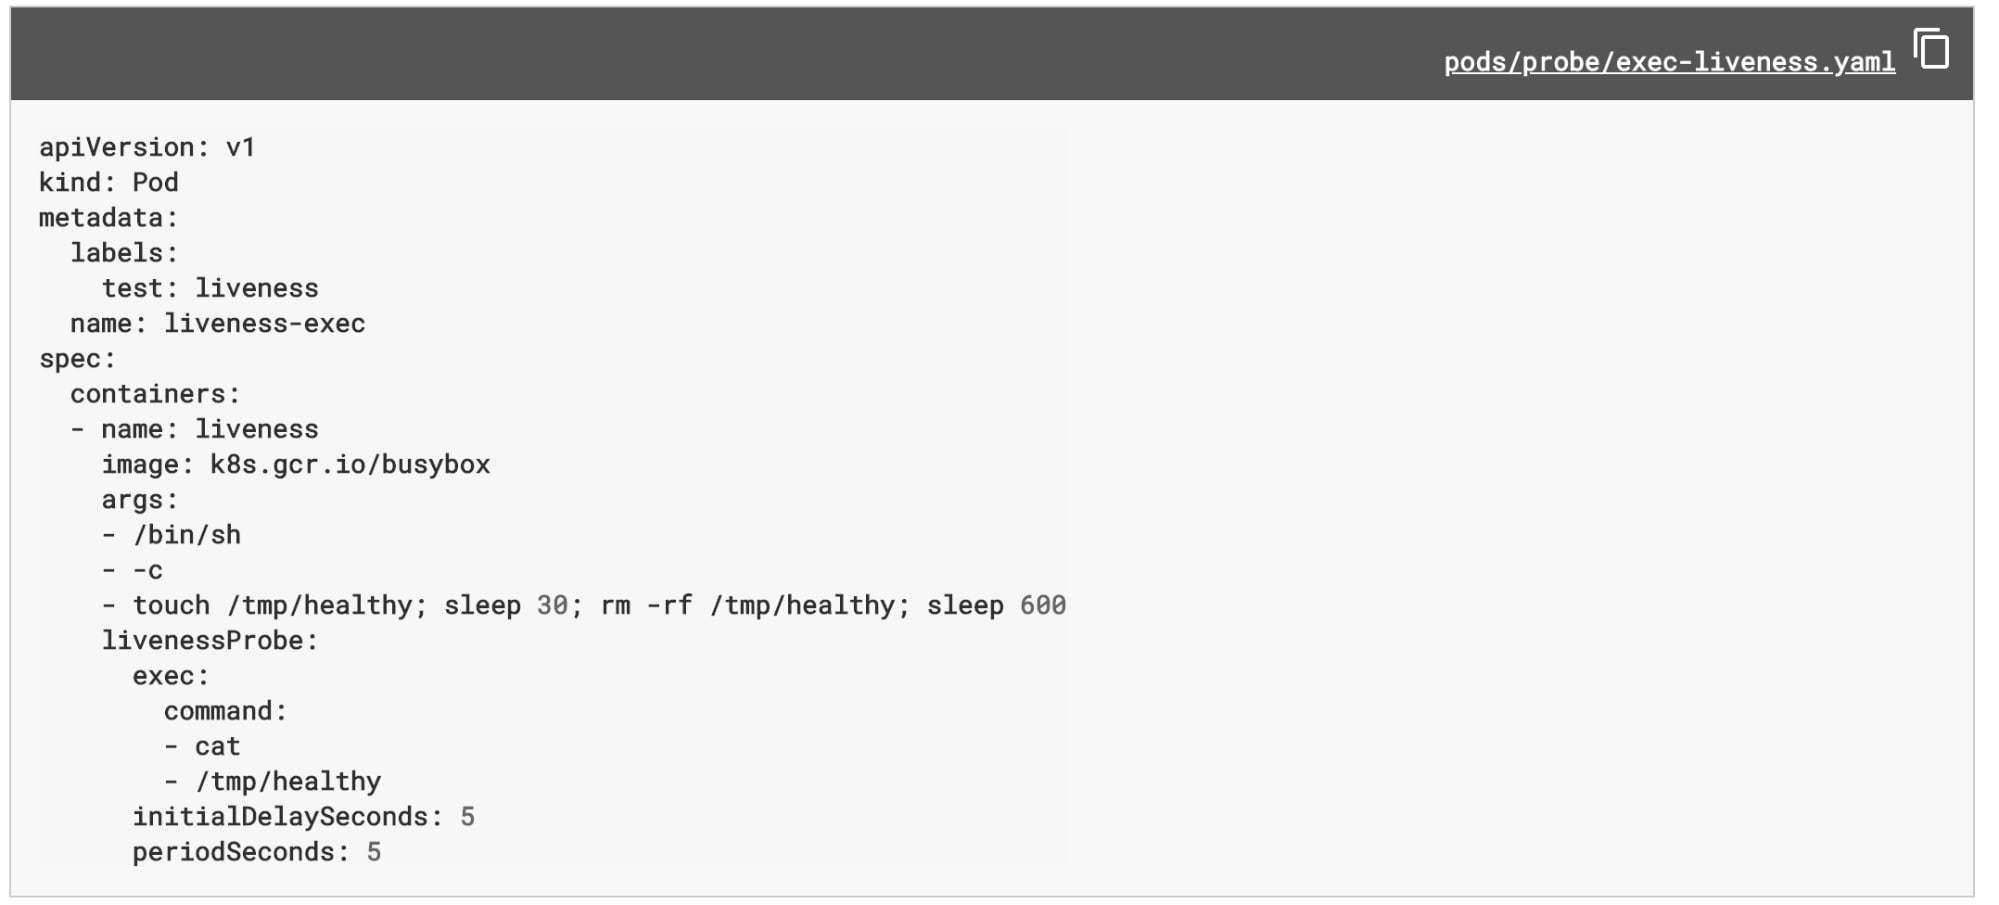
Readiness probes are conducted by Kubernetes to know when a Container is ready to start accepting traffic.
cAdvisor
cAdvisor is an open source container resource usage and performance analysis agent. It is purpose built for containers and supports Docker containers natively. In Kubernetes, cAdvisor is integrated into the Kubelet binary. Hence it runs at every node instead of the pod. cAdvisor auto-discovers all containers in the machine and collects CPU, memory, filesystem, and network usage statistics.
Although cAdvisor provides basic machine-level performance characteristics, it also lacks analytics and persistence to understand trends
Metrics API and Metrics Server
Starting from Kubernetes 1.8, resource usage metrics, such as container CPU and memory, disk usage, are available in Kubernetes through the Metrics API.
Metrics API does not store the value over time – i.e. by calling the API you can find out what is the value of resource utilization now but it cannot tell you what the value was 10 minutes ago.
Inspired by Heapster, which is now deprecated, Metric server makes the resource usage at nodes and pods level via standard APIs the same way the other Kubernetes APIs are accessed.
Metric Server provides performance data via APIs and can be configured to persist the data over time, however, it lacks analytics and visualization capabilities.
Kubernetes Dashboard
Kubernetes Dashboard provides basic UI to get resource utilization information, manage applications running in the cluster as well as to manage the cluster itself.
Kubernetes Dashboard can be accessed with the following command:
$ kubectl apply -f https://raw.githubusercontent.com/kubernetes/dashboard/v1.10.1/src/deploy/recommended/kubernetes-dashboard.yaml
To access Dashboard from your local workstation you must create a secure channel to your Kubernetes cluster. Run the following command:
$ kubectl proxy
Kubernetes Dashboard can now be accessed here.
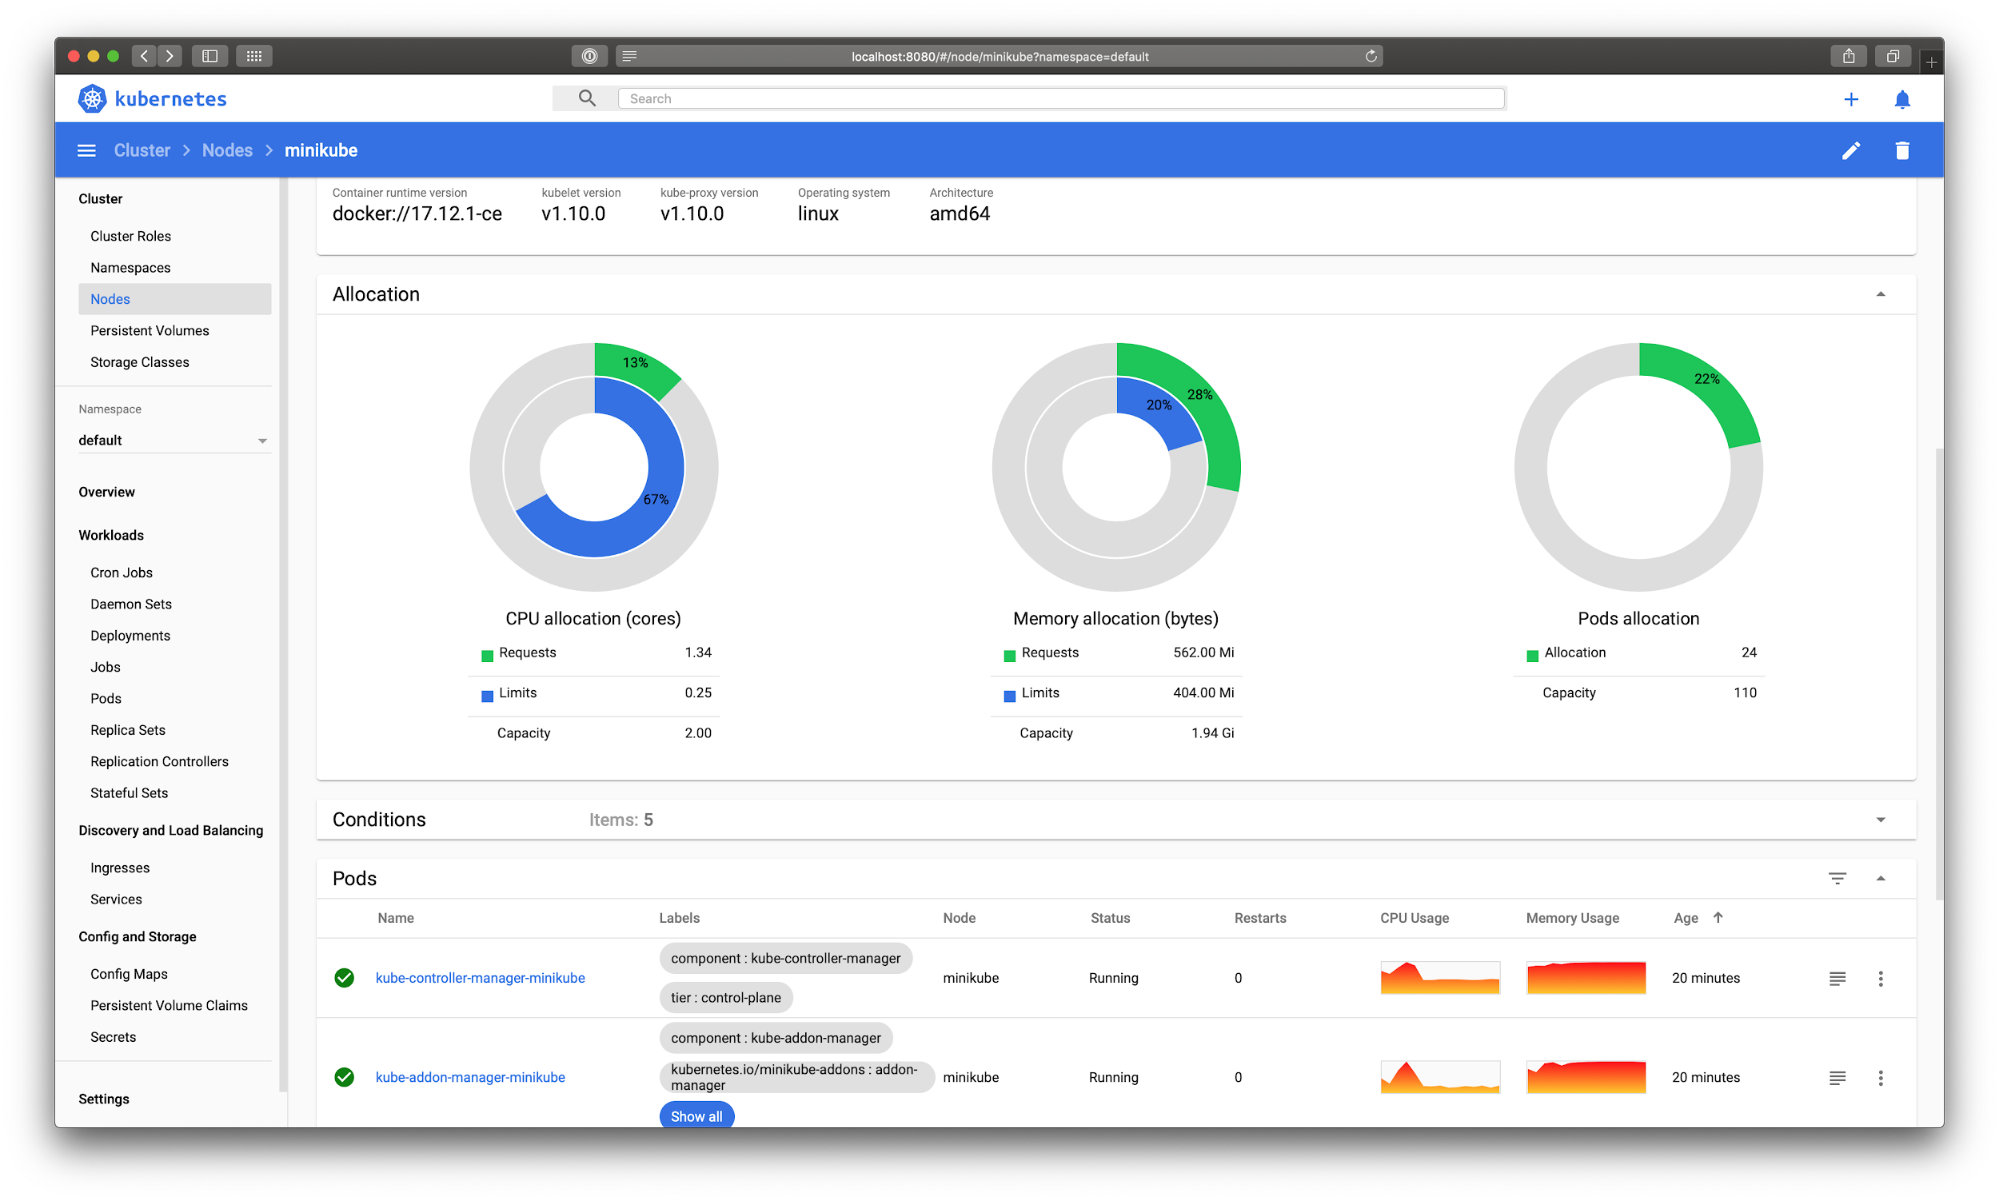
While Kubernetes dashboard provides basic visualization, it depends on Heapster, which is now deprecated.
Kube-state-metrics
Typically used in conjunction with Heapster, Kube-state-metrics is a simple service that listens to the Kubernetes API server and generates metrics about the state of the objects such as Deployment, Node, PersistentVolume, Pod, Service, etc. a full list of all exposed metrics is available here.
Kube-state-metrics provides the information in the raw plain text form and provides an end-point to scrape the metrics. DevOps teams would need to bring their own metrics storage, visualization, and alerting tools to make data from Kube-state-metrics actionable.
Prometheus
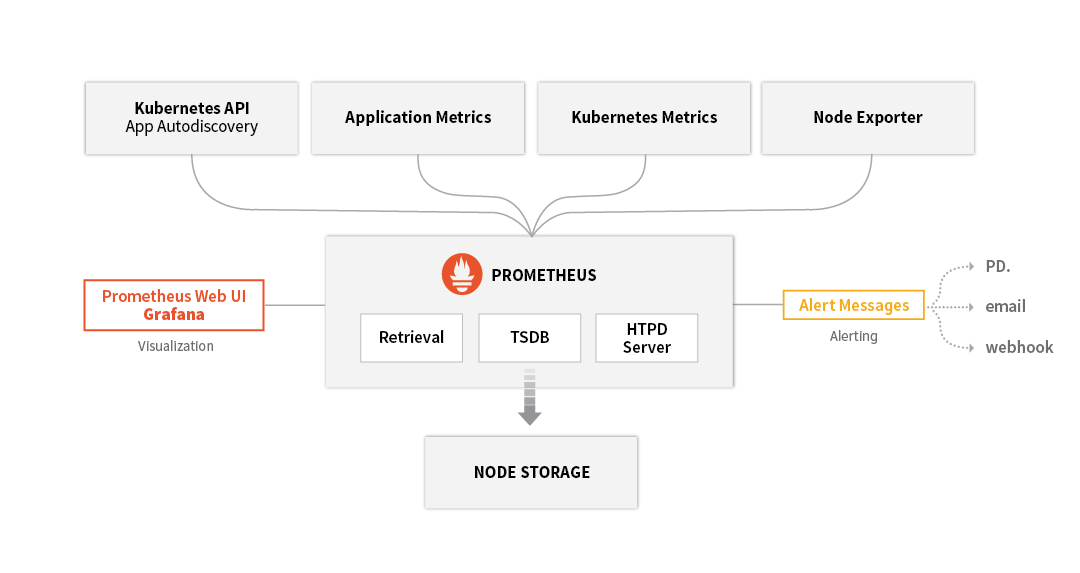
Prometheus provides a way to get end-to-end visibility into your Kubernetes environments. Prometheus monitoring system is however much more than just the Prometheus time series database – to get complete visibility, you will need to install and maintain the entire Prometheus monitoring system as shown below:
Challenges with Prometheus
While it is easy to get started with Prometheus in dev, test environments, teams quickly realize that by default Prometheus lacks enterprise-grade features to monitor mission-critical workloads in production and at scale. Primarily, the challenges are:
- Visualization: Additional tools such as Grafana are needed for visualization
- Authentication, and Authorization: Prometheus and its components do not provide any server-side authentication, authorization or encryption. If you require this, it is recommended to use a reverse proxy.
- Local file storage: Prometheus by default is a local on-disk time series database, but it also optionally integrates with remote storage systems with the support of 3rd party adapters
- Lack of end-to-end troubleshooting: Prometheus does not provide end-to-end visibility and troubleshooting capabilities by tracing transactions across distributed services
Conclusion
Monitoring applications in Kubernetes may seem daunting to the uninitiated. Fortunately, it’s not very different at all from application monitoring in other contexts. The main difference is in the way application data is exposed within a Kubernetes cluster. Getting at the data you need is a little more challenging than you’re likely used to, but it’s hardly an insurmountable task once you understand the architectures at play.
- IT Monitoring
- Application Performance Monitoring
- APM vs Network Performance Monitoring
- Security Monitoring
- Cloud Monitoring
- Data Monitoring
- Endpoint Monitoring
- DevOps Monitoring
- IaaS Monitoring
- Windows Infrastructure Monitoring
- Active vs Passive Monitoring
- Multicloud Monitoring
- Cloud Network Monitoring
- Database Monitoring
- Infrastructure Monitoring
- IoT Monitoring
- Kubernetes Monitoring
- Network Monitoring
- Network Security Monitoring
- RED Monitoring
- Real User Monitoring
- Server Monitoring
- Service Performance Monitoring
- SNMP Monitoring
- Storage Monitoring
- Synthetic Monitoring
- Synthetic Monitoring Tools/Features
- Synthetic Monitoring vs RUM
- User Behavior Monitoring
- Website Performance Monitoring
- Log Monitoring
- Continuous Monitoring
- On-Premises Monitoring
- Monitoring vs Observability vs Telemetry
See an error or have a suggestion? Please let us know by emailing [email protected].
This posting does not necessarily represent Splunk's position, strategies or opinion.
Related Articles
About Splunk
The Splunk platform removes the barriers between data and action, empowering observability, IT and security teams to ensure their organizations are secure, resilient and innovative.
Founded in 2003, Splunk is a global company — with over 7,500 employees, Splunkers have received over 1,020 patents to date and availability in 21 regions around the world — and offers an open, extensible data platform that supports shared data across any environment so that all teams in an organization can get end-to-end visibility, with context, for every interaction and business process. Build a strong data foundation with Splunk.


