Setting up the OpenTelemetry Demo in Docker
The OpenTelemetry demo application can be deployed using Docker.
Prerequisites
If you’d like to follow along, you’ll need the following software:
- git
- Docker
- Docker Compose (if not included with your instance of Docker)
- Splunk Observability Cloud
- Splunk Cloud Platform
You’ll want to have at least 4 GB of RAM available on your machine to run the demo application.
Create a new index
You can create a new index for the application logs. This is optional, but for our example, let’s create an index named “astronomyshop”.
- In Splunk Cloud Platform, navigate to Settings -> Indexes -> New Index.
- Enter the index properties you want, as shown in the following screenshot.

For further details on the index creation process, see Create events indexes.
Generate a Splunk HTTP Event Collector token
To use HTTP Event Collector (HEC) to send log data to Splunk Cloud Platform, we need to first generate a token.
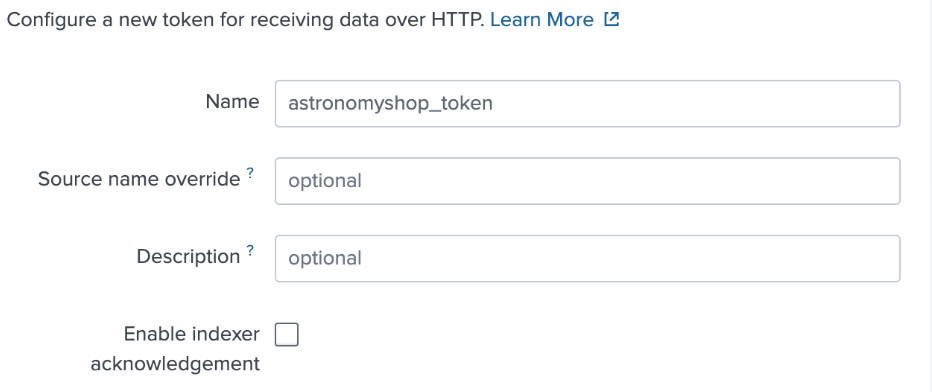
- In Splunk Cloud Platform, navigate to Settings -> Data Inputs -> HTTP Event Collector -> New Token.
- Provide a name for the token, such as “astronomyshop_token”.

- Specify which index(es) you’d like the HEC token to send events to. In our case, we’ll send events to the “astronomyshop” index.

- After the token has been created successfully, make a note of its value for future reference.
For further details on the token generation process, see Create an Event Collector token on Splunk Cloud Platform.
Generate a Splunk Observability Cloud access token
While we’ll send log data to Splunk Cloud Platform, we’ll be sending metrics and traces to Splunk Observability Cloud. This requires an access token.
- In Splunk Observability Cloud, navigate to the Settings Wheel ☸ -> Access Tokens -> New Token.
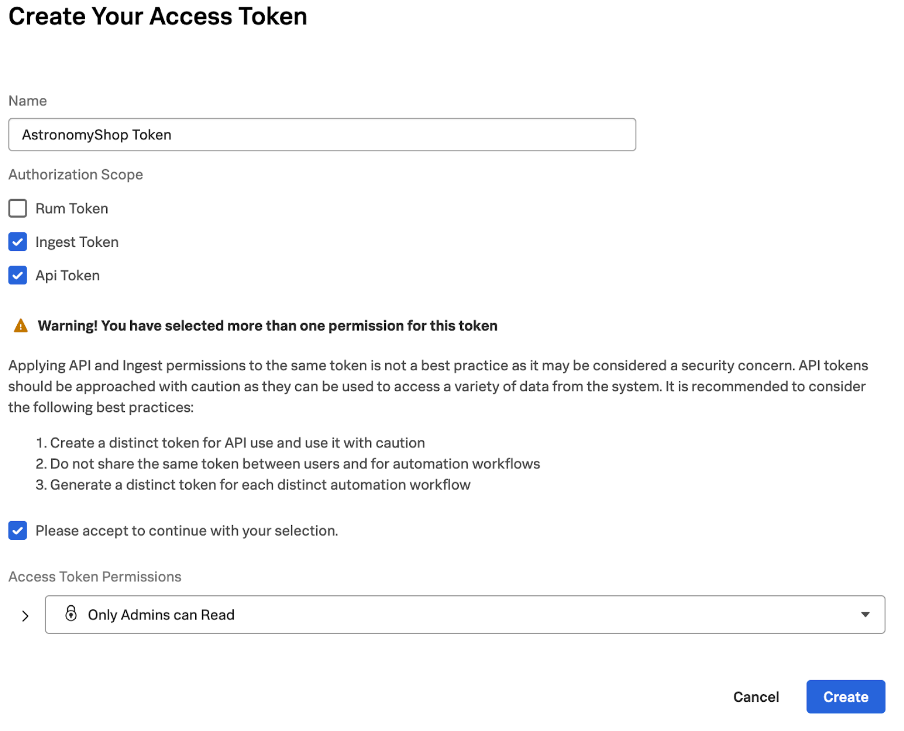
- Enter a name for the token such as “AstronomyShop Token”.
- Because we'll use this token for both ingest and API, select the options shown in the following screenshot.

- Make a note of the token for future reference, as we’ll need it below.
For further details on the creation process, see Create an access token. The OpenTelemetry demo application generates approximately 5,000 custom metrics, primarily due to metrics related to Kafka and RPC. If you’d like to minimize custom metric usage within your Splunk Observability Cloud account, set a custom metric limit on the token used to instrument the demo application. For more information, see Manage data ingest using access tokens.
Install the OpenTelemetry Demo
Navigate to a directory where you’d like to work with the demo application code. For example:
cd ~/Documents/Code/
Then, grab the source code for the demo repository by running the following commands:
git clone https://github.com/signalfx/opentelemetry-demo.git
Navigate to this directory:
cd opentelemetry-demo
Configure the OpenTelemetry Demo
Set the following environment variables using the tokens created above:
export SPLUNK_ACCESS_TOKEN=<ingest token>
export SPLUNK_REALM=<your realm, e.g. us0, eu0>
export SPLUNK_HEC_TOKEN=<The Splunk HEC authentication token>
export SPLUNK_HEC_URL=<The Splunk HEC endpoint, e.g. https://abc.splunkcloud.com:port>
export SPLUNK_MEMORY_TOTAL_MIB=1024
Review the OpenTelemetry Collector service configuration
We’ve updated the docker-compose.yml file to utilize the Splunk Distribution of the OpenTelemetry Collector rather than the collector-contrib distribution. Copy it into the root folder of the demo application by running the following command:cp splunk/docker-compose.yml docker-compose.yml
The updated configuration looks as follows.
otelcol:
 image: quay.io/signalfx/splunk-otel-collector:latest
 container_name: otel-col
 deploy:
   resources:
     limits:
       memory: 125M
 restart: unless-stopped
 command: ["--config=/etc/otelcol-config.yml"]
 volumes:
   - ./splunk/otelcol-config.yml:/etc/otelcol-config.yml
   - ./logs:/logs
   - ./checkpoint:/checkpoint
 ports:
   - "4317" # OTLP over gRPC receiver
   - "4318" # OTLP over HTTP receiver
   - "9464"
   - "8888"
   - "13133"
   - "14250"
   - "14268"
   - "6060"
   - "9080"
   - "9411"
   - "9943"
 depends_on:
   - jaeger
 logging: *logging
 environment:
   - ENVOY_PORT
   - SPLUNK_ACCESS_TOKEN=${SPLUNK_ACCESS_TOKEN}
   - SPLUNK_REALM=${SPLUNK_REALM}
   - SPLUNK_HEC_TOKEN=${SPLUNK_HEC_TOKEN}
   - SPLUNK_HEC_URL=${SPLUNK_HEC_URL}
   - SPLUNK_MEMORY_TOTAL_MIB=${SPLUNK_MEMORY_TOTAL_MIB}
The collector will utilize the configuration file stored at ./splunk/otelcol-config.yml. The collector is configured to export metrics and traces to Splunk Observability Cloud, using the environment variables set earlier.
Run the OpenTelemetry Demo
Run the demo application using the following command:
docker compose up --force-recreate --remove-orphans --detach
In some environments, you may need to run docker-compose instead of docker compose.
After a minute or so you should see the application components appearing on the service map by navigating to APM -> Explore in Splunk Observability Cloud.

Next step
The Splunk Distribution of the OpenTelemetry Collector is running, and is sending metrics and traces to Splunk Observability Cloud. Now, we can get logs into Splunk Cloud Platform as well. Our Splunk OpenTelemetry Collector has already been configured to send data to Splunk Cloud Platform via the splunk_hec exporter.
exporters:
splunk_hec:
 token: "${SPLUNK_HEC_TOKEN}"
 endpoint: "${SPLUNK_HEC_URL}/services/collector"
 source: "otel"
 sourcetype: "otel"
 index: "astronomyshop"
 profiling_data_enabled: false
 tls:
   insecure_skip_verify: false
If you’re using a trial instance of Splunk Cloud Platform, set the insecure_skip_verify attribute in the splunk/otelcol-config.yml, splunk/otelcol-config-filelog.yml, and splunk/otelcol-config-fluentd.yml files to “true”. This is required as a trial instance includes a self-signed certificate, and is not intended for production usage.
While the collector is configured to export logs to Splunk platform, it is not currently configured to receive logs. To address this, see Getting Docker log data into Splunk Cloud Platform.

