Setting up the OpenTelemetry Demo in Kubernetes
The OpenTelemetry demo application can be deployed using Kubernetes.
Prerequisites
If you’d like to follow along, you’ll need the following software:
- git
- Docker
- A Kubernetes cluster v1.23+ (you can use minikube if running locally)
- Helm v3.9
- Splunk Observability Cloud
- Splunk Cloud Platform
You’ll want to have at least 4 GB of RAM available on your machine to run the demo application.
Install the Splunk Distribution of the OpenTelemetry Collector for Kubernetes
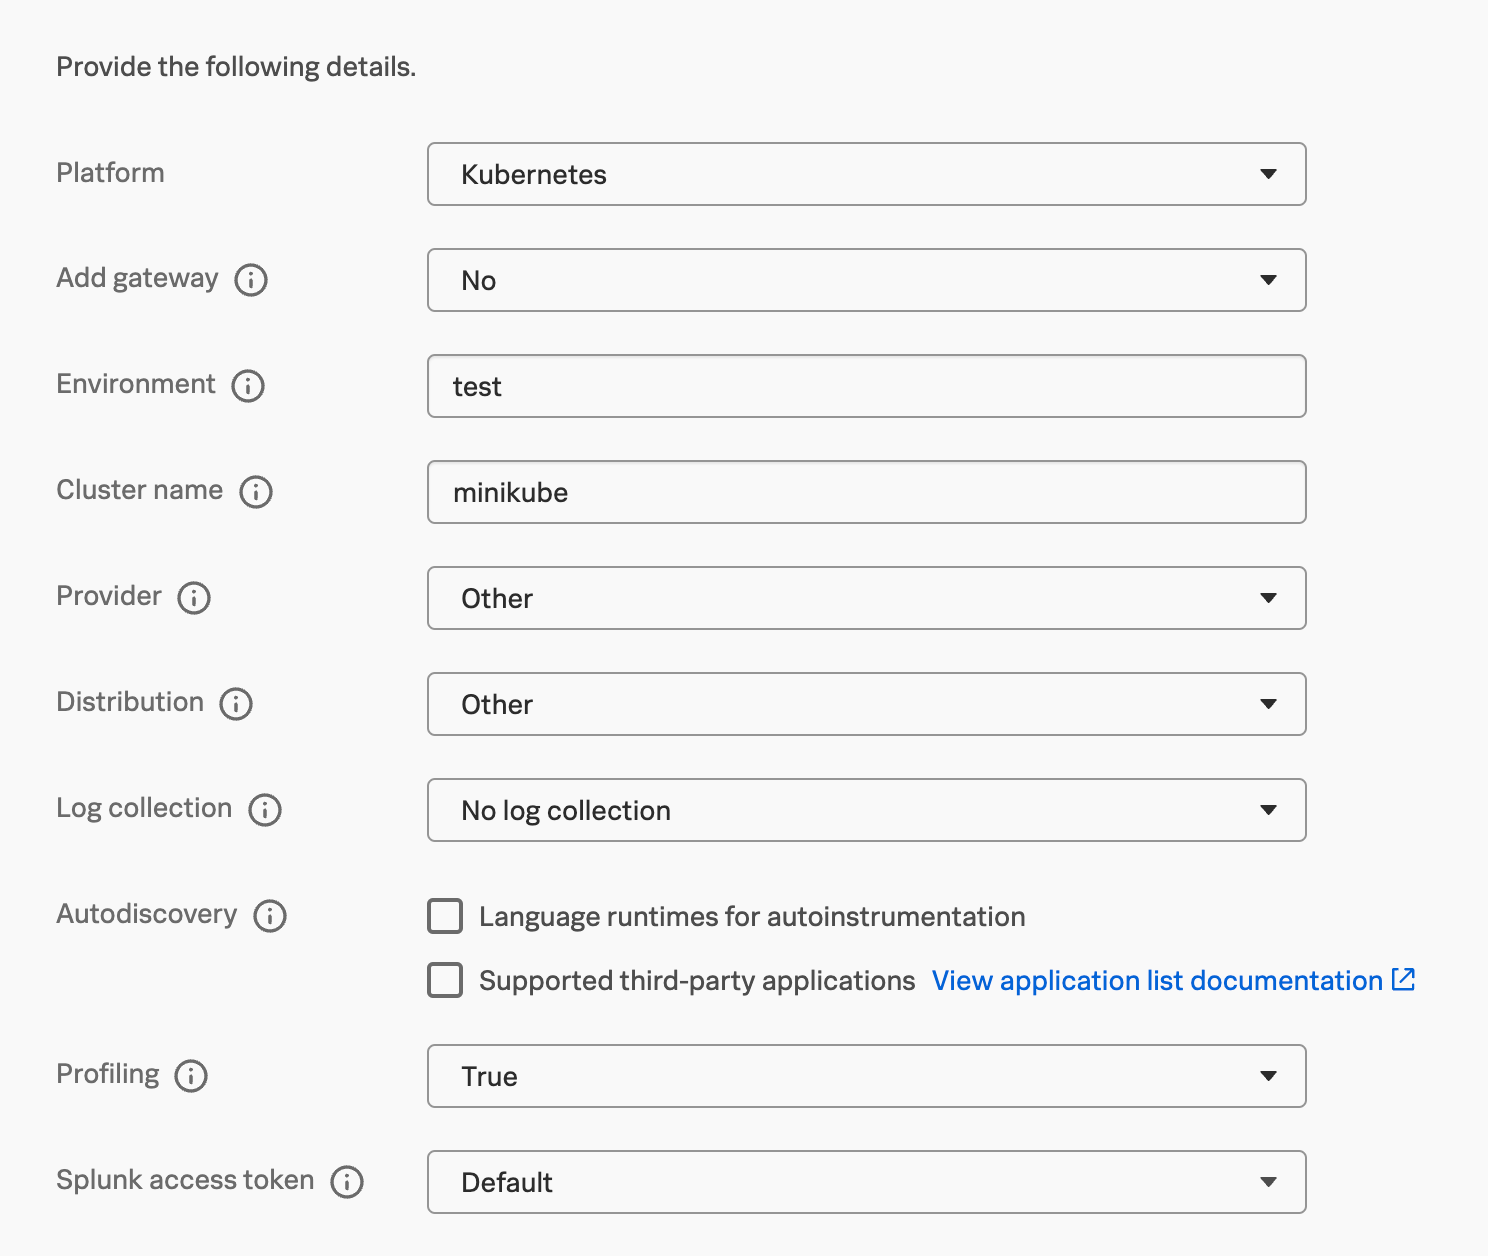
Use the Splunk Observability Cloud guided installation for deploying the Splunk Distribution of the OpenTelemetry Collector for Kubernetes in our Kubernetes cluster. You can find the guidance at Data Management -> + Add Integration -> Kubernetes. Note the following settings:
- If you’re using minikube, the cluster name is typically “minikube”.

- If deploying the demo application to a public cloud environment such as AWS, Azure, or GCP, select the appropriate settings for Provider and Distribution.
Next, we’ll get a list of commands we can use to deploy the Splunk Distribution of the OpenTelemetry Collector to our Kubernetes cluster using Helm.

After these commands are executed, you should start to see data flowing into Splunk Observability Cloud after a minute or so.

Point to the Splunk Distribution of the OpenTelemetry Collector
Our demo application includes its own OpenTelemetry collector. But for our example, we want to leverage the Splunk Distribution of the OpenTelemetry Collector that’s already running in our Kubernetes cluster, which is already configured to export data to Splunk Observability Cloud.
To do this, we modified the splunk/opentelemetry-demo.yaml and replaced the value of the OTEL_COLLECTOR_ENDPOINT environment variable for each service as follows.
- name: NODE_IP
  valueFrom:
    fieldRef:
      fieldPath: status.hostIP
- name: OTEL_EXPORTER_OTLP_ENDPOINT
  value: http://$(NODE_IP):4317
This tells each service to utilize the IP address of the node it runs on to connect to the collector.
We also updated the OTEL_RESOURCE_ATTRIBUTES for each service to include the deployment.environment attribute:
- name: OTEL_RESOURCE_ATTRIBUTES
value: service.name=$(OTEL_SERVICE_NAME),service.namespace=opentelemetry-demo,deployment.environment=development
In our example, we set this to “development”, but feel free to change it if you wish.
Create a namespace for the OpenTelemetry Demo
Next, let’s create a separate namespace to deploy our demo application into.
kubectl create namespace otel-demo
Run the OpenTelemetry Demo
Run the demo application using the following command:
kubectl apply --namespace otel-demo -f
./splunk/opentelemetry-demo.yaml
After a minute or so you should see the application components appearing on the service map by navigating to APM -> Explore in Splunk Observability Cloud.

Next steps
The OpenTelemetry Demo is running, and is sending metrics and traces to Splunk Observability Cloud. Now, to get logs into Splunk Cloud Platform, let's look at Getting Kubernetes log data Into Splunk Cloud Platform with OpenTelemetry.
Splunk OnDemand Services: Use these credit-based services for direct access to Splunk technical consultants with a variety of technical services from a pre-defined catalog. Most customers have OnDemand Services per their license support plan. Engage the ODS team at [email protected] if you would like assistance.


