Passive TLS mirroring

TLS inspection provides visibility of network threats hidden inside TLS encrypted sessions. This functionality is provided today by either Active or Passive TLS Interception.

Active TLS Interception is achieved by inserting a cryptographic system inline (for example a web proxy or man-in-the-middle appliance) between the clients and the servers. These inline systems can then make a copy of the clear text before/after encrypting/decrypting, inspect it locally and optionally send it out to another device (TLS mirroring).

Passive TLS Interception can be achieved by snooping the ephemeral session key of each TLS session and provide the key to the network monitoring system. The network monitoring system can then use the key to decrypt and inspect the TLS payloads.

Both of these techniques require extra hardware (whether it is virtual or not) and additional cryptographic operations. They also introduce significant complexities, some vulnerabilities and additional points of failure.

Passive TLS mirroring

Passive TLS mirroring is a hybrid between active and passive TLS interception that (1) is well suited for both public cloud and on-premise environments, (2) is much simpler to implement and (3) does not require additional hardware or cryptographic operations.

Passive TLS Mirroring leverages open source TLS implementations and works by making a copy of the clear text at the interface between the application (like httpd or curl) and the TLS library (like openessl). Coupled with a patent-pending algorithm to map the text to network flows, this unique mechanism implements a reliable TLS mirror of the decrypted TLS sessions without sharing keys or requiring additional cryptographic operations. The open source portion of the mechanism is exemplified below:

send(security_context,clear_text, destination) {
send_to_agent(clear_text); //added by MetaFlows
encrypt(security_context,clear_text,encrypted_text);
transmit(encrypted_text,destination);
}
receive(security_context,encrypted_text) {
decrypt(encrypted_text,clear_text);
send_to_agent(clear_text);    //added by MetaFlows
return(clear_text);
}

As you can see, we simply provide a local agent (called sslcollector) that receives the clear text messages obtained with a simple instrumentation (send_to_agent) of the send and receive TLS API calls. The clear text is then forged into TCP/IP packets that mimic the corresponding TLS session. Optionally, we can also decode HTTP2 to appear as traditional HTTP 1.1.
Cloud-based passive TLS mirroring
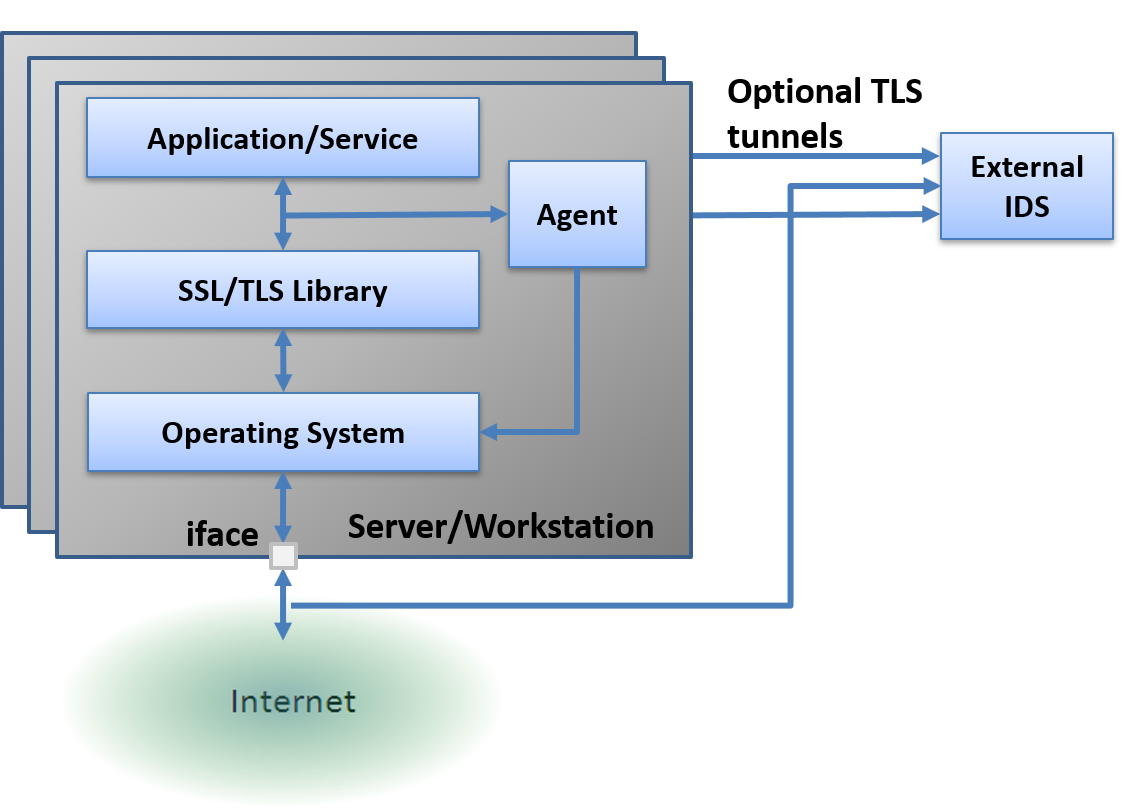
Passive TLS Mirroring a public cloud like AWS

Passive TLS mirroring works especially well in cloud based deployments where the mirrored TCP/IP packets are sent (optionally encapsulated in a TLS tunnel) to an external monitoring system such as a remote IDS sensor. Each system being monitored would execute the command below:

sslcollector -I <iface> -t <ip_address> 

The IDS sensor at <ip_address> would replay the decrypted packets to <iface> by executing:

sslcollector -C -o <iface>

The IDS sensor simply receives the decrypted TCP/IP traffic without having to perform any decryption or having to fetch or manage ephemeral session keys in real time.
On-premise passive TLS mirroring
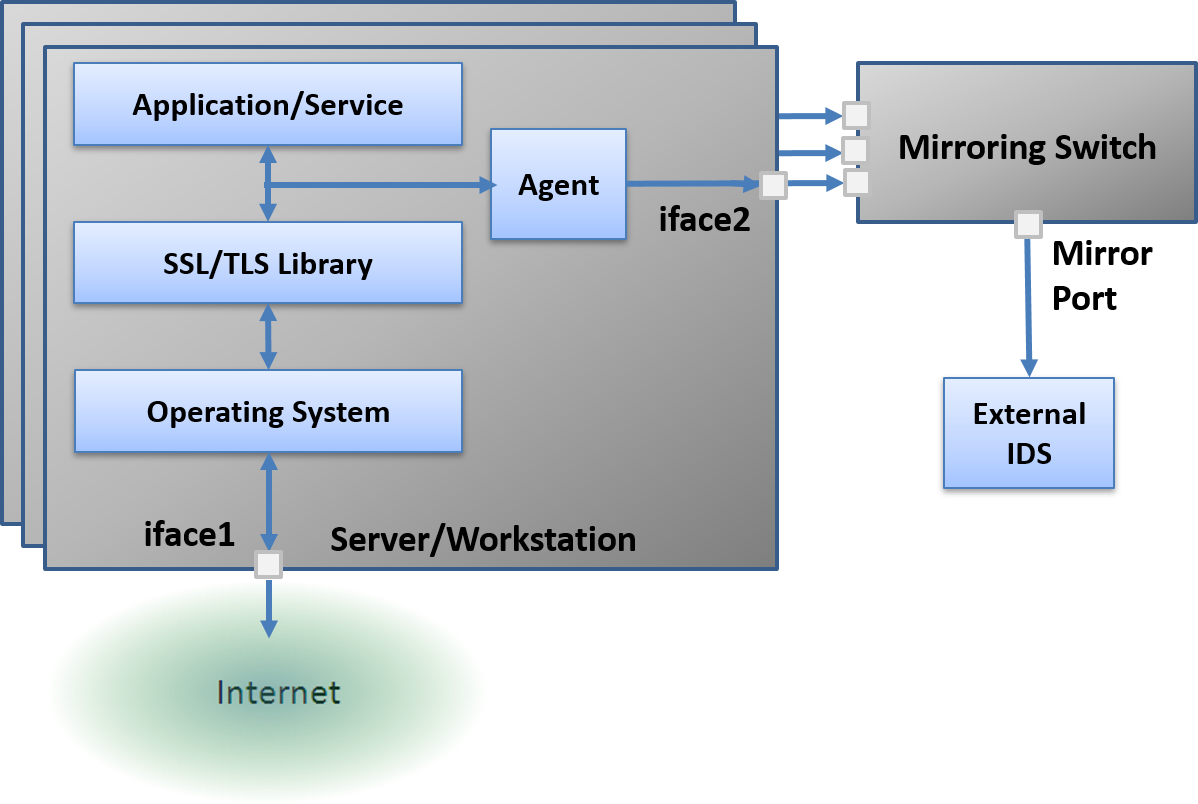
On premise Passive TLS Mirroring

Our technology also works on-premise. In its simplest form, the clear text obtained from the application is replayed through a secondary interface to an external switch. Each system being monitored would execute the command below:

sslcollector -I <iface1> -o <iface2>

The switch aggregates the mirrors and sends them to the IDS system. In a more port-efficient, on-premise implementation a simple Linux aggregation appliance can aggregate multiple mirrors before sending them to the switch.

Comparison

The table below compares important features of existing TLS inspection approaches. As you can see from the table, Passive TLS Mirroring offers a number of unique advantages.

Does not affect availability or performance
TLS Mirroring in the cloud & on-premise
End-to-end encryption
Transparent to monitoring system or IDSPartial
No additional key management/vulnerability
No additional cryptographic operationsPartial
Comparison of TLS inspection approaches

An inline appliance whether it is a Man-in-the-middle (MITM) appliance or a web load-balancer such as Nginx affect performance and reliability. Even though these systems can mirror the clear text, (1) they are not available or difficult to implement in public clouds such as AWS and (2) are not transparent to the endpoints and the monitoring systems.

Ephemeral session key extraction and distribution shares some of transparency properties of passive TLS mirroring but suffers from the operational burden of (1) having to distribute potentially thousands of keys per second in a timely fashion to the IDS system and (2) forcing the IDS system to decrypt TLS packets (in addition to the all other traditional functions) . Obviously, the ephemeral keys (if leaked) can compromise forward security (someone can record the TLS traffic and later decrypt it with the ephemeral keys) thus introducing an additional security risk.

In summary, we believe that Passive TLS Mirroring has significant practical advantages over existing solutions (especially in cloud-based deployments).

How to get it

We offer passive TLS mirroring as an add-on to the MetaFlows Security System or as a stand-alone offering to augment any existing traffic monitoring systems. Passive TLS mirroring installs in minutes on any main-stream Linux distribution and recent Windows versions.

Please contact [email protected] for further details and a trial.

AWS Guard Duty Support

Guard Duty is a basic, easy-to-use intrusion detection system provided by Amazon Web services. The main benefit of Guard Duty is that is extremely easy to setup (one click). Over time, the user can customize the detection and prevention rules to make the AWS findings more useful.

One big draw back of Guard Duty is that it provides very little forensic and correlation capabilities. As with most intrusion detection systems, the user can only look at single events in isolation without the ability of investigating why they where generated within a more general security context. Without this deeper understanding, single events are not very useful and, more importantly, by themselves may fail to reveal more important security insights.

MetaFlows now supports the analysis and correlation of AWS Guard Duty events thus providing a more advanced forensic capability through the MetaFlows Security System (which includes full packet logging, pcap generation and a number of advanced forensic tools) .

Setup

Guard Duty only works within each availability zone; therefore you will need a MetaFlows sensor running in the same availability zone where you want to run Guard Duty.

Below are the steps necessary to forward guard duty events to a MetaFlows sensor.

  • Enable Guard Duty.
  • Find out your Guard Duty MetaFlows port for the sensor to which you want to export Guard Duty events. Please contact MetaFlows’ support on how to find this value
  • Go to the Amazon SNS service and create a topic called guardduty Note: The Amazon SNS topic must be in the same Region as your AWS Guard Duty service.
  • Open the CloudWatch console.
  • In the navigation pane, choose Rules, and then choose Create rule.
  • From the Service Name menu, choose GuardDuty.
  • From the Event Type menu, choose GuardDuty Finding.
  • In Targets, choose Add target.
  • In Select Target, choose SNS topic.
  • In Select Topic, choose your SNS topic guardduty
  • Click configure details and enter a mnemonic name like Guarddutytometaflows
  • Go back to the SNS console and select the topic guardduty
  • Click on Create subscription
  • Select HTTPS protocol
  • Under endpoint enter https://sensor.metaflows.net:<port> where <port> is the port number that you obtained in step 2 and click on Create subscription
  • Click on Subscriptions and verify the new subscription status is Confirmed

After the subscription is confirmed, you will start receiving Guard Duty Events in the MetaFlows system such as the ones below:

Samaple Guard Duty Events
Forensic Analysis Menu

As any other event type, Guard Duty events are aggregated by IP addresses, ports and classes so you can easily explore the event types hierarchically and correlate them with other MetaFlows events that share the same IP addresses. Importantly (as shown here) you can also run several forensic tools on the events including inspecting the payloads associated with the network activity that triggered the events. You can also easily start blocking the servers or the clients with our IPS system as well as initiate vulnerability scanning.

If you are interested in exploring how MetaFlows can augment AWS Guard Duty or other AWS security products, do not hesitate contacting us.

Thanks and Happy Hunting!

Web Application IDS Update

We updated the passive web application IDS rules from Spiderlabs. These rules should be much more useful. You can set the mode in the sensor configuration as Server or Client. In server mode the Web IDS will alert if we see any suspicious request that caused the server to respond with any HTTP code. In client mode we generate alerts only if a client malformed requests are (1) persistent across multiple servers, (2) trigger different Web IDS rules and (3) elicit error responses from the servers.

Server mode allows you to see how you web servers are being targeted and helps you create better Web application filtering rules. Client mode triggers more rarely and finds persistent attempts that go beyond occasional false positives or probing. If you see a client from your network triggering the We application IDS system, it is a good indication that it is running bad applications or it is accessing questionable services.

If you want to turn off some of the rules, search for the rule ID under Rules->ModSecurity Rules (after you select the appropriate sensor), slide the disable switch and Save and Restart.

Web Application IDS rules correlated with a Snort IDS rule and syslog messages.

To search for Web Application IDS rules only look for modsec using the Search form and set the event type to any. As shows above modsec alerts will also be correlated with your Emerging Threats IDS rules and other external syslog messages and therefore you will also see them if you search for correlated alerts.

Let us know if you have any questions.

Happy Hunting!

How to Stop Malware in the Cloud

Moving digital assets to the public cloud reduces costs and increases productivity, but it poses some new information security challenges. Specifically, many IDPS that were designed for the on-premises network come up short when deployed in the public cloud. Public cloud providers have built-in security layers to manage information security using their own security monitoring infrastructure to address this problem, but these built-in monitoring services are one-size-fits-all and may miss crucial customer-specific security requirements or user account compromises. This leaves cloud-based assets more vulnerable to data breaches.

And the threats are there. An April 3, 2019 article in ZDNet mentioned that over 540 million Facebook records were exposed on AWS. In 2017, 57 million Uber customer records were compromised because hackers extracted Uber’s AWS credentials from the company’s private GitHub account. Public cloud offers no tools for monitoring the network data that would have detected and prevented these breaches.

Why public clouds are difficult to secure
Public clouds are great when it comes to providing shared compute resources that can be set up or torn down quickly. The cloud provider offers a basic software interface to provisioning storage, servers and applications, and basic security monitoring that runs on top of that interface at the application layer. But the application layer runs on top of the network, and the network is the only place where certain classes of dangerous security breaches can be detected and prevented.

Clouds restrict users from inspecting or logging the bits that go over the network wire. Inspecting a public cloud at the application layer can give customers information about what the network endpoints are doing, but that’s only part of the picture. For example, breaches due to users’ misbehavior are only visible at the network layer by observing the communication patterns that are inconsistent with company policies. The cloud’s built-in monitoring services would not be aware of this misbehavior because they do not monitor network behavior on behalf of the enterprise. Importantly, if malware or a rogue application somehow makes it into a cloud instance or remote VM hosted in the cloud, cloud-native monitoring services may not detect malicious behavior at the network level. Because customers don’t have access to the bits being transmitted, they’ll never know the malware is there.

So what’s a cloud customer to do? Adding NG firewalls from third-party vendors to public cloud deployments adds the ability to customize the inspection of all the bits flying by, but fails to detect communications within the cloud (i.e., between a web server and a database) or lateral communications (for example, a compromised host trying to spread within the internal cloud network between VMs). This leaves blind spots that can allow malware to execute without the user’s knowledge. Lastly, when there is a breach, in most cases, cloud customers can’t even quantify, precisely, the number of records or the amount of data  exfiltrated.

As it’s not feasible to deploy hardware on a public cloud provider’s premises, the way to eliminate these blind spots lies with software that can implement a virtual tap and monitor traffic at the network level. Today, only MetaFlows offers multi-function software that will address these needs.

A New Way to Secure SSL/TLS Traffic

Secure Sockets Layer (SSL) and its successor, Transport Layer Security (TLS), are the primary means of securing traffic between web browsers and web servers. Organizations need to detect and prevent network-based compromises that can be carried through SSL/TLS traffic, but many legacy solutions present problems. SSL/TLS interception is usually achieved by proxying the encrypted sessions through an in-line security device or software daemon which terminates the SSL/TLS session, decrypts the content and re-encrypts it before communicating with the intended recipient. Some issues associated with such in-line architecture include the need for an in-line device and the related cost, latency increases, decreased network availability and potential security exposure. In this article, we’ll look at a new way to inspect SSL/TLS traffic that does not require an in-line device and thus overcomes traditional challenges.

The SSL/TLS Attack Vector
Any exploit that can be carried out in regular traffic can be carried out over SSL/TLS. Because the session is encrypted, it makes exploits harder to detect. Sometimes, the same exploit can be carried out over SSL and non-SSL. SSL can hide applications that the enterprise doesn’t want, such as peer-to-peer systems or instant messaging apps. Most organizations have policies in place that prevent certain content from being posted to public sites, and they want to be able to enforce these policies about what can travel on the network. But SSL-encrypted traffic makes it difficult to enforce those policies.

In terms of malware, a network analyst can’t find virus exploits or other attacks that use SSL/TLS to communicate. The alternative is to monitor endpoint addresses, but endpoint addresses change frequently, leading to false positives and false negatives. In addition, users may use SSL/TLS to download executables, and it’s difficult to block that traffic if it can’t be detected. For example, most phishing and pharming attacks occur in SSL/TLS traffic.

Traditional SSL/TLS Monitoring
The traditional method of dealing with this challenge is to buy an in-line device that decrypts SSL/TLS traffic, inspects it, and then re-encrypts it. There are two key issues with this approach:

Increased latency – because there’s a box in the middle of the traffic that has to decrypt, inspect, and encrypt the data stream before passing it onto the server, the user will experience higher latency in the connection. SSL/TLS inspection device manufacturers try to mitigate latency by adding processing power to their systems, but this increases the cost of the device. In-line inspection devices can cost from $20,000 to $150,000, depending on processing capacity.

Reliability – If the in-line device fails, so does access to the network. And the in-line device needn’t fail to interrupt network access. Browser-server configurations change frequently, and these devices aren’t always up to date, so they can deny legitimate traffic. In addition, the in-line device is responsible for the cryptographic keys that enforce security on the connection. These cryptographic keys may not be configured correctly, and misconfigurations can also interfere with network access.

In virtualized networks, users could implement SSL/TLS interception functionality with in-line software appliances. This approach compounds the problems mentioned above because virtual software appliances have limited CPU capacity to handle multiple real-time traffic flows between the clients and the servers. Public key decryption and encryption are very CPU-intensive, and the traffic can easily overwhelm the in-line software system when the software is inspecting traffic from multiple endpoints to multiple servers. The need for decentralizing this in-line approach in virtual environments would significantly increase costs and compound the reduced availability and security concerns of this architecture.

Endpoint SSL/TLS Monitoring
Here’s another approach: Passive SSL/TLS inspection. Instead of running the inspection capability in the network, it can be run in the endpoints. This is accomplished by running an agent on each endpoint to collect traffic in clear text (before/after it is encrypted/decrypted for transmission/reception over the network), and by sending those results to a server-based or virtual machine-based sensor for inspection and correlation.

Basically, the agent is a transparent tap into the endpoint’s traffic, and it makes a memory copy. This passive SSL/TLS inspection occurs on the endpoints before the traffic is encrypted and sent to the server, so it doesn’t interfere with traffic between the client and server at all.

This approach has several advantages. There’s no increased latency because the agent doesn’t interfere with the network traffic. If the agent stops working for some reason, it doesn’t interfere with the endpoint user’s activity. The agent also has nothing to do with the cryptographic keys, so there are no security or configuration issues.

Passive SSL/TLS inspection addresses the major problems of in-line inspection, maintains the one-to-one relationship between the endpoint and the server, and enables network analysts to see what’s being transmitted over secure sessions. As networks become increasingly virtualized, endpoint SSL/TLS inspection will be the only way to see and react to network exploits conducted via encrypted tunnels between browsers and web servers. Passive TLS/SSL is available today as a software subscription service from MetaFlows Inc. for any Linux distribution, Windows 10 and Windows Server 2016.

Cloud Agents Statistics

Many of you use the MetaFlows Security System to monitor cloud-based instances. Agents running on the instances send their network packets to the sensor for inspection. We now report the real time bandwidth each agent produces.

The sensors which receive network traffic from agents will now have a clickable button that reveals the agents’ statistics.

Clicking on the button, will open a table with each agent IP address, the source port being used and the Kbps being sent. These stats change in real time.

Hovering will reveal some passive host discovery information (DNS, MAC, DHCP info, HTTP Agents, Proxies, etc). Clicking on each agent IP will open up an historical report for that IP to see what that instance has been up to in the last day or so.

And, ho, yeah.. we added some links on the dashboard. One can be used to rate us for Amazon (30 seconds survey) and one for Gertner (this will take you 10-15 minutes or so but they give you a $25 gift card). We would appreciate if you could give us feedback.

Thanks!

Feel free to contact us if you have any questions. Happy Hunting!

MineMeld Support

MineMeld is an open source threat feed management system that gathers IP addresses, URLs, and domains which pose a significant network security threat. The threat feed sources can either be free, subscription-based or proprietary.  MineMeld re-scans the feeds at regular time intervals and continuously aggregates and updates the set of all threat indicators to be consumed by fierwalls, IDS/IPS, or any other security device.

MetaFlows now includes MineMeld public threat feeds to augment our existing intelligence sources. The public threat feeds amount to about 200,000 additional indicators updated every few hours. Users also have the ability to add site-specific (either subscription-based or private) MimeMeld sources.

IPv4 and URL/Domain indicators are treated differently.

IPv4 feeds

The default MineMeld IPv4 feeds processed by MetaFlows are below:

Source Current Number of Indicators
https://lists.blocklist.de/lists/all.txt 56953
https://feodotracker.abuse.ch/blocklist.php?download=badips 61
https://www.binarydefense.com/banlist.txt 4098
http://osint.bambenekconsulting.com/feeds/c2-ipmasterlist.txt 459
https://rules.emergingthreats.net/open/suricata/rules/compromised-ips.txt 2473
https://www.dshield.org/block.txt 20
http://malc0de.com/bl/IP_Blacklist.txt 105
http://www.malwaredomainlist.com/hostslist/ip.txt 1001
http://reputation.alienvault.com/reputation.data 70666
https://ransomwaretracker.abuse.ch/downloads/RW_IPBL.txt 315
https://www.spamhaus.org/drop/drop.txt 770
https://www.spamhaus.org/drop/edrop.txt 113
https://sslbl.abuse.ch/blacklist/sslipblacklist.csv 136

MineMeld IPv4 addresses are compiled in a set of IDS/IPS rules designed to alert or block communications to blacklisted addresses.  MetaFlows uses a proprietary technique to quickly look through this huge list of addresses (140,000+) and therefore does not require specialized hardware for hi-speed networks.

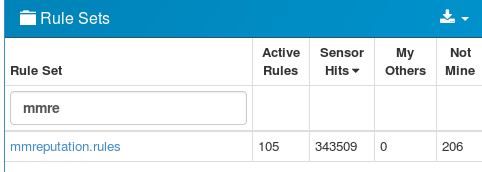
reputation ruleset


The MineMeld IPv4 feeds are in the mmreputation.rules configuration file that can be accessed through the existing IDS rule management UI. The feeds are  not activated by default but users can activate them in IDS or IPS mode with just a few clicks. If enabled, these rules can be very useful to detect and/or prevent communication to questionable hosts on the Internet.


All the IP addresses are reduced to approximately 40 separate signatures. Each signature corresponds to a specific feed source (for example blocklist_de) or intersections of sources where the IPv4 address is present in more than one source (for example blocklist_de_alienvault.reputation). This decomposition provides additional operational awareness that can be used to prioritize which set of IPs to alert on or block. Enabling or blocking individual signatures therefore affects  a dynamically changing set of potentially thousands of IPs updated every few hours that map to a single threat feed or the intersection of multiple threat feeds.

Users also have the option of adding site-specify MineMeld IPv4 feeds to enable additional commercial MineMeld subscriptions independently purchased or other proprietary feeds.

Entering the URL as shown above, will automatically add the custom MineMeld reputation feed into the customer’s configuration and the local rule corresponding to the feed can then be managed as the other public MineMeld feeds.

URL and Domain FeedS

The MineMeld domain and URL feeds processed by MetaFlows are below:

Source Current Number of Indicators
https://www.badips.com/get/list/any/3?age=2w 33593
http://osint.bambenekconsulting.com/feeds/c2-dommasterlist.txt 719
http://malc0de.com/bl/BOOT 111
https://ransomwaretracker.abuse.ch/downloads/RW_DOMBL.txt 1903
https://ransomwaretracker.abuse.ch/downloads/RW_URLBL.txt 11567
https://ransomwaretracker.abuse.ch/downloads/TC_DS_URLBL.txt 271
https://urlhaus.abuse.ch/downloads/text/ 102880
http://vxvault.net/URL_List.php 101

These feeds are used to detect when:

  • A user issues an HTTP request to a URL or domain deemed to be malicious or
  • A user receives an email containing a malicious URL or link to a malicious domain whether or not the user clicks on the links.

When either of these two conditions occur, a high priority even is generated that can be used to block those specific communications.

There is also a an additional option to enable real time email notification. When bad emails are detected, users also get a warning email instructing them to discard the email.

MineMeld support will automatically be added next time your system self updates or if the sensor software is restarted.


What is Multi-session Correlation?

Traditional IDS: A1;A2;A3 are independent Multi-session: A1, A2, A3 are correlated
Traditional network intrusion detection systems (IDS) generate alerts by finding known threat patterns within a single TCP session. This is very blunt. Important events (A3) are often missed due to the high volume of false positive alerts (A1). To be effective, traditional IDS need constant tuning and expert analysis.

Multi-session correlation is an evolution of dialog-based correlation extended to leverage diverse global threat intelligence. Simply put, it automatically connects the dots between notable TCP sessions between a single internal host and multiple external hosts over time. It produces incident reports containing multiple events related to the same threat (A2+A3) rather than giving you independent alerts. This works much better, it will save you time and money in defending your enterprise.

You can try it on your network for free. Register at nsm.metaflows.com and build your own network malware detection appliance within minutes. All you need is some decent hardware with 2 Network Interface Cards and a span/mirror port from your switch.

How to Deploy Open Source Network IDS/IPS in AWS

Open Source Network IDS/IPS in Amazon AWS

The easiest way to deploy a Network IDS to monitor your AWS instances is to setup a Linux security gateway. It does require some amount of IP networking knowledge but it is a very flexible way to manage your cloud assets as if they where in your LAN.

The EC2 security gateway routes IP traffic between the VPC and the Internet and therefore has complete visibility of the full-duplex traffic to and from your protected instances. The Network IDS running on the EC2 gateway instance will then allow you to identify and shut down threats as if it was deployed in a physical network.

Setting up a Linux Security Gateway in AWS

Create a VPC

Launch a VPC (Amazon’s virtual private cloud network) and give it a non-routable network range (ex. 10.0.0.0/8). Your VPC will need a private subnet (ex. 10.1.1.0/24) and a public subnet (ex. 10.1.100.0/24), if you do not already have two subnets then go ahead and create them.

Set up the gateway in AWS:

Launch a Linux EC2 instance on the public subnet of your VPC to be your network gateway, this will probably be the only instance on the public subnet for most deployments. Any Linux OS should be fine, but we prefer and use examples from CentOS.

Your gateway instance will need to be assigned at least one Elastic IP Address (EIP), this will be the public address that people will use to reach your network and the gateway will map that address to the correct instance on the private subnet.

You will need to modify the network adapter for your gateway instance to DISABLE src/dst Checking, this is required for it to properly function as a router.

Configure the gateway as a Router

After it starts, configure the gateway as a router for your private subnet. Execute the following commands assuming your private network subnet is “10.1.1.0/24”:

sudo -s
echo 1 > /proc/sys/net/ipv4/ip_forward
iptables -t nat -A POSTROUTING -s 10.1.1.0/24 -j MASQUERADE

The above commands first give you a root shell (required to make networking changes), second tell the system to forward network packets that are destined for other networks, and third act as the source for all network traffic originating from your private subnet.

Add additional IP addresses on the public subnet (if needed):

EC2 will automatically assign an address to your instance, that is part of the public subnet, once it is launched. Each instance can have additional IP addresses on the public subnet.

For each of these IP addresses you can assign an Elastic IP Address to correspond to it, thus allowing your router to receive traffic for multiple public IP addresses and route it to multiple internal private hosts. Limits may apply depending on the type of instance you choose.

Set up the routing tables:

The public subnet should have a default route (0.0.0.0/0) to an amazon Internet Gateway device. If your VPC doesn’t yet have an internet gateway, you will need to add one for the public subnet.

The private subnet should have a default route (0.0.0.0/0) to the public facing interface id of the gateway instance. Do not add a route for your private subnet to an amazon Internet Gateway Device, otherwise they will route through it instead of your Linux gateway.

Launch the instances to be monitored

If you haven’t already, launch the EC2 instances that you wish to be monitored in the private subnet.

Add port forwarding

For each of the private subnet instances, add port forwarding rules to the iptables on your linux gateway for their publicly accessible services. You can follow these instructions to do that https://access.redhat.com/knowledge/docs/en-US/Red_Hat_Enterprise_Linux/4/html/Security_Guide/s1-firewall-ipt-fwd.html

Add Network IDS software

Once you have the traffic for your Amazon EC2 assets going through your own Linux gateway, you can deploy any traditional IDS systems in order to monitor your traffic. For example, in our example scenario, the gateway interface for the private subnet is “eth1”, and so we can invoke Snort to monitor all of our amazon traffic by pointing it to that interface:

# snort -f -c /nsm/etc/snort.serv.conf -A console -y -i eth0 --daq-dir /usr/local/lib/daq --daq pfring --daq-var clusterid=88
Running in IDS mode
--== Initializing Snort ==--
...
Commencing packet processing (pid=22129)
Decoding Ethernet
12/03/18-14:51:21.844473 [**] [1:2022775:1] ET USER_AGENTS BLEXBot User-Agent [**] [Classification: Misc activity] [Priority: 3] {TCP} 148.251.139.168:52916 -> 10.10.1.253:80
12/03/18-14:52:40.396441 [**] [1:2025534:10000] ET WEB_SPECIFIC_APPS Drupalgeddon2 8.3.9 8.4.6 8.5.1 RCE Through Registration Form (CVE-2018-7600) [**] [Priority: 0] {TCP} 45.37.49.53:35458 -> 10.10.1.253:443
12/03/18-14:52:40.483478 [**] [1:2025534:10000] ET WEB_SPECIFIC_APPS Drupalgeddon2 8.3.9 8.4.6 8.5.1 RCE Through Registration Form (CVE-2018-7600) [**] [Priority: 0] {TCP} 45.37.49.53:35458 -> 10.10.1.253:443
...

If you want to deploy an advanced commercial network IDS in your cloud environment I suggest you take a look at our turnkey solution. It does not require setting up a Linux gateway and provides an unprecedented number of advanced features not available in open source systems.

Qradar Support

The MSS now fully supports the Qradar SIEM from IBM in CEF log format. Qradar is an excellent SIEM but requires classifying and mapping every event type it sees to an internal category. Qradar comes with a large number of common IDS rules (~50,000) already classified but not mapped. Besides having to manually map all these rules Qradar-MSS users would also need to continuously create additional Qradar IDs (Qids) to map to the much larger rule set used by the MSS (which changes daily). All this required a mechanism to update Qradar dynamically as new rules are published. With this update released today, no manual classification or mapping operations are necessary.

The MetaFlowsCEF log source automatically parses the 13 event types generated by the MSS and presents them in the Qradar default view. All MSS events are automatically mapped to new or existing Qids without any user manual operations. This makes the Qradar SIEM much easier to use.

To setup Qradar for the MSS perform the following steps:

    1. Download the MetaFlowsCEF log source https://nsm.metaflows.com/sensordevicetype-search-ContentExport-20180809173340.zip to the Qradar box
    2. Import it with the command /opt/qradar/bin/contentManagement.pl -action import -f sensordevicetype-search-ContentExport-20180809173340.zip
    3. Verify the import was successful and assign the MetaFlows sensors to this log source. Also make a note of the log source ID assigned by Qradar to the MetaFlowsCEF log source (something like 400[1-9]).
    4. Edit the file mss.sh of all sensors and add the line export QRADAR=1.
    5. On one of the sensors you designate as the main Qradar updater, create the file /nsm/etc/qradar.ini to allow the sensor to communicate to the Qradar server (see an example below). Also add the line export QRADARLOGSOURCEID=<logsourceid>; where <logsourceid> is the number you noted in step 3. Probably something like 4001, or 4002, etc..
    6. Restart the sensors

Sample qradar.ini:

[DEFAULT]
certificate_file = /nsm/etc/qradar.pem
auth_token = f3f1201b-3562-46d1-9b8b-9a1623870000
server_ip = 123.52.215.20
Where:
/nsm/etc/qradar.pem is a copy of the file located at /etc/httpd/conf/certs/cert.cert on your Qradar box
auth_token is obtained from your QRADAR application
server_ip is the IP address of your Qradar box.

The Qradar updater sensor will automatically add to Qradar new IDS rules added by the sensor’s rule update (which will be the same across all your sensors). This will happen through the Qradar API in the background as the sensor is running. The first time, the updater is run, it will have to catch up with about 50,000 definitions; so it will take many hours. Subsequent updates will take less time.

After each Qradar update, the email associated with the sensor owner will receive a summary of the update process.

Qradar integration is a bit complex; so do not hesitate to contact [email protected] for any questions.