Reducing MTTD and increasing observability with Linkerd at loveholidays
Challenge
loveholidays needed consistent observability across services to improve overall observability and incident detection. With trillions of hotel-flight combinations processed daily, decentralized metrics made it difficult to standardize monitoring across applications, impacting MTTD. The lack of metrics uniformity slowed their ability to detect regressions and resolve performance issues, directly impacting customer conversion rates due to slower search response times.
Solution
loveholidays implemented Linkerd for consistent metrics across services, regardless of programming language or framework used. By adopting the service mesh, loveholidays standardized observability through “Golden Signals,” providing a uniform view of service performance and enabling faster incident detection.
Impact
Implementing Linkerd had a significant impact on loveholidays’ operations. By reducing their MTTD and improving observability, the engineering team was able to catch hundreds of failed deployments early, preventing potential outages. This led to a reduction in incident response times and improved stability. The faster identification of performance issues contributed to a better user experience, which directly correlated with a 2.61% increase in customer conversion rates in 2023. Additionally, the team optimized internal traffic, reducing network costs, while the adoption of automated canary deployments allowed for safer and more reliable production updates.
By the numbers
Trillions
of hotel and flight combinations processed per day
1500+
production deployments per month
5k pods
in prod w/ ~300 deployments/stateful sets
In this case study, you’ll learn how love holidays uses Linkerd to provide uniform metrics across all services, decreasing incident Mean Time To Discovery (MTTD) and increasing customer conversion by reducing search response times.
Introducing loveholidays
Founded in 2012, loveholidays is the largest and fastest-growing online travel agency in the UK and Ireland. Having launched in the German market in May 2023, loveholidays aims to open the world to everyone by offering their customers unlimited choices with unmatched ease and unmissable value, providing the perfect holiday experience. To achieve that, they process trillions of hotel/flight combinations per day, with millions of passengers traveling with us annually.
Meet the engineering team
loveholidays has around 350 employees across London (UK) and Düsseldorf (Germany), with more than 100 employees in Tech and Product, and constantly growing. Their current engineering headcount is around 60 software engineers and five platform engineers.
Engineering at loveholidays is scaled based on five simple principles, embodying a “you build it, you run it” engineering culture. Engineers are empowered to own the full software delivery lifecycle (SDLC), meaning every engineer is responsible for their services at every step of the journey, from design to deploying to production, building monitoring alerts/dashboards, and day-2 operations.
The infrastructure team’s goal is to enable self-service operations for developers. They do this by identifying common problems and friction points and then solving them with infrastructure, process, and tooling. As huge open-source advocates, they are constantly pushing the boundaries and working on cutting-edge technology.
loveholidays’ infrastructure
In 2018, loveholidays migrated from on-prem to GCP (check out their Google case study), with 100% of their infrastructure now in the cloud. The team runs 5 GKE clusters spread across production, staging, and development environments, with all services running in one primary region in London. They are actively working on introducing a multi-cluster, multi-region architecture (learn more about their multi-cluster expansion in this blog post).
The platform team runs around 5,000 production pods with about 300 Deployments / StatefulSets, all managed by their development teams. The languages, frameworks, and tooling used are all governed by the teams themselves. Services are written in Java, Go, Python, Rust, JavaScript, or TypeScript, among others. That language diversity is due to one of their engineering principles: “Technology is a means to an end,” meaning teams are encouraged to pick the best language for the task rather than having to conform to existing standards.
They use Grafana’s LGTM Stack (Loki, Grafana, Tempo, Mimir) for all observability needs, along with other open-source tools such as the Prometheus-Operator to scrape application’sapplication’s metrics, ArgoCD for GitOps along with Argo Rollouts and Kayenta powering canary deployments.
With GitOps-powered deployments, each month, they deploy to production over 1,500 times. They move fast, and they occasionally break stuff.
Time is money; latency is cost
Search response time directly correlates with customer conversion rate — the likelihood of a customer completing their website purchase. In other words, it’s absolutely vital for loveholidays to monitor the latency and uptime of their services to spot regressions or poorly behaving components. Latency also correlates with infrastructure cost as faster services are cheaper to run.
Since teams are responsible for creating their application monitoring dashboards and alerts, historically, each team reinvented the wheel, resulting in consistent visualizations, incorrect queries/calculations, or missing data. A simple example is one application reporting throughput in requests per minute while another is reporting requests per second. Some applications would record latency in averages, and others with percentiles such as P50/P95/P99, but not always consistently.
These small details made it nearly impossible to compare the performance of any given service quickly. Observers had to understand the dashboards for each application before beginning to evaluate its health.
“We couldn’t quickly identify when one application was performing particularly badly, meaning our MTTD for regressions introduced with new deployments would have a direct impact on our sales/conversion rate.”
Dan Williams, Senior Infrastructure Engineer at loveholidays
Linkerd: the answer to disparate metrics and observability problems
Each language and framework brings a new set of metrics and observability challenges. Simply creating common dashboards wouldn’t be an option, as no two applications present the same set of metrics, and this is where the platform team decided that a service mesh could help. A service mesh would provide an immediate and uniform set of Golden Signals (latency, throughput, errors) for HTTP traffic, regardless of the underlying languages or tooling.
In addition to uniform monitoring, Williams and team knew a service mesh would help with a number of other items on their roadmap, including mTLS authentication, automated retries, canary deploys, and even east-west multi-cluster traffic.
The next question was which service mesh? Like most companies, they evaluated Linkerd and Istio, both CNCF-graduated service meshes. The platform team had brief previous exposure to Istio and Linkerd, having tried and failed to implement both meshes in the early days of their GKE migration. They knew Linkerd had been completely rewritten with 2.0 and decided to pursue it as their Proof of Concept (PoC).
One of the engineering team’s core principles is “Invest in simplicity, ” which perfectly aligns with Linkerd’s philosophy. For their initial PoC, they installed Linkerd to their dev cluster using the CLI, added the Viz plugin (which provides real-time traffic insights in a nice dashboard), and finally added the `linkerd/inject: enabled` annotation to a few deployments. That was it. It just worked. They had standardized golden metrics generated by Linkerd’s sidecar proxies, mTLS securing pod-to-pod traffic, and they could listen to live traffic using the tap feature — all within about 15 minutes of deciding to install Linkerd in dev!
“Linkerd as a product aligned exactly with how we approach engineering by investing in simplicity. We had a clear goal: Solve the problem without additional complexity or overhead. The PoC stage made it immediately clear that Linkerd was the right solution. Additionally, the entire Linkerd community deserves a shoutout. Everyone involved is incredibly open and willing to help.”
Dan Williams
The implementation
To roll Linkerd out into production, they decided to take a slow and calculated approach. It took them over six months to get to full coverage, as they onboarded a small number of applications at a time and then carefully monitored these in production for any regressions. loveholidays’ implementation journey is detailed in this three-part blog series on the loveholidays tech blog: Linkerd at loveholidays — Our journey to a production service mesh.
This slow approach may seem counterintuitive, given they chose Linkerd for both ease and speed of deployment. However, edge cases exist, and things tend to break unexpectedly as no two production environments are created equal.
Throughout their onboarding journey, they identified and fixed several edge case issues. Examples include connection and memory leaks, requests dropped due to malformed headers, and several other network-related issues. Previously hidden, the Linkerd proxy started exposing all these issues.
Williams particularly likes the following excerpt from the Debugging 502s page in Linkerd’s documentation: “Linkerd turns connection errors into HTTP 502 responses. This can make issues which were previously undetected suddenly visible.”
The platform team’s efforts to address these issues and the Linkerd maintainer’s receptiveness and willingness to help led to code fixes in loveholidays and Linkerd’s code base. As they progressed through their onboarding journey and identified different failure modes, they added new Prometheus and Loki (logs) alerts to quickly alert them to issues related to the service mesh before they become problems.
“Since early 2023, `linkerd/inject: enabled’ has been the default setting for all new applications deployed via our common Helm Chart and isn’t even something we think about anymore.”
Dan Williams
They built a common dashboard based on Linkerd metrics, and for each application, they automatically get the following data points:
- “Golden Signals” HTTP metrics (throughput, latency, errors, success rate)
- Service to service traffic:
- Inbound traffic & success rate per service
- Outbound traffic & success rate per service
- TCP connections
- Per-Route HTTP metrics (driven by ServiceProfiles)
- Resource information (pods, CPU, memory etc via kube-state-metrics)
- Linkerd-Proxy logs
- …and more.
Every new service is automatically meshed, providing near-full observability for each service as soon as deployed.

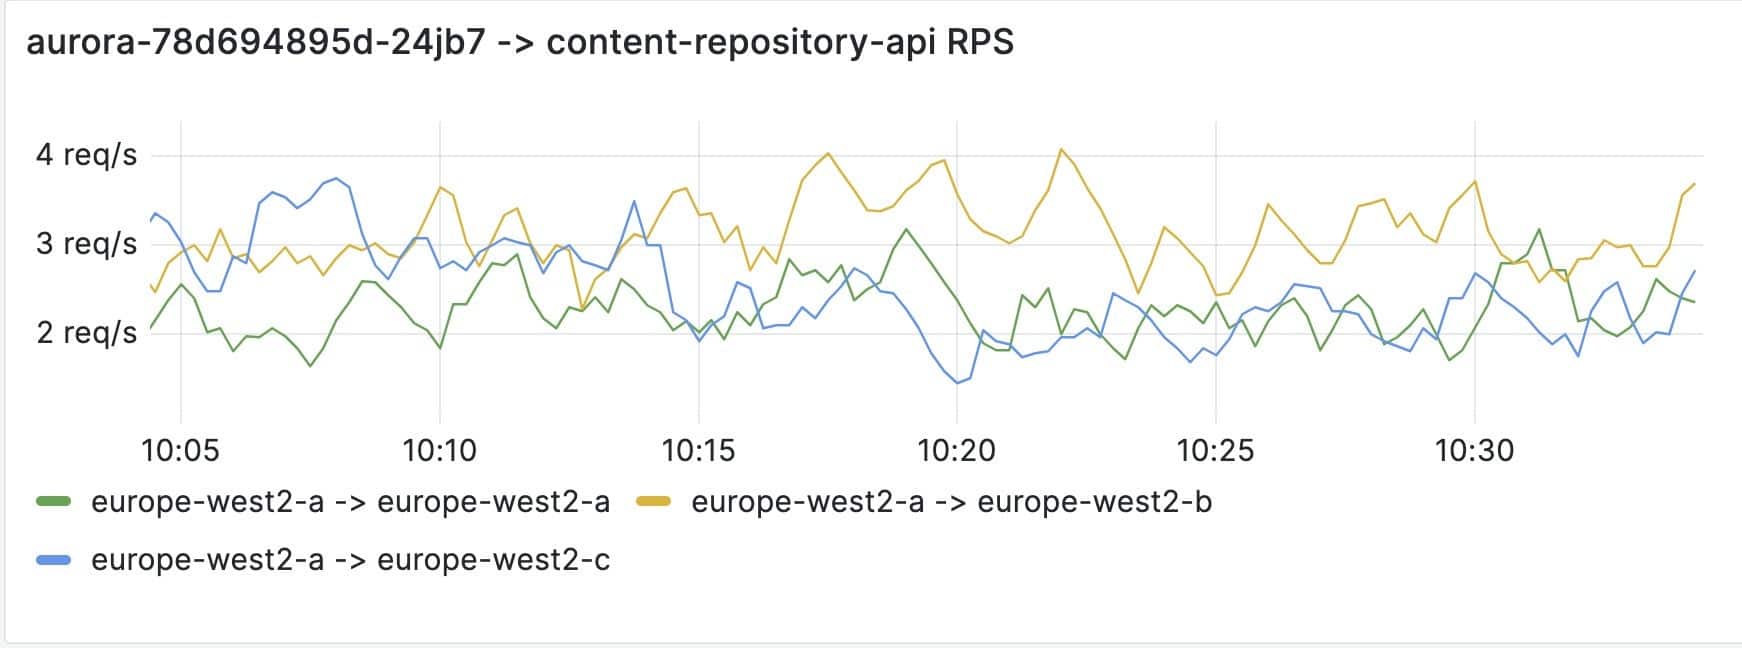
Traffic from and to different services is fully observable, and the team can quickly identify if, for example, a particular downstream service is responding slowly or is erroring. While previous dashboards might have told them requests were failing, they weren’t able to easily identify the source or destination service for those failing requests.

Linkerd’s throughput metrics, combined with pod labels from Kube State Metrics, produced dashboards identifying cross-zone traffic inside the cluster, which the team used to optimize traffic, saving significant networking spend. They also plan to use Linkerd’s HAZL feature to further reduce cross-zone traffic.

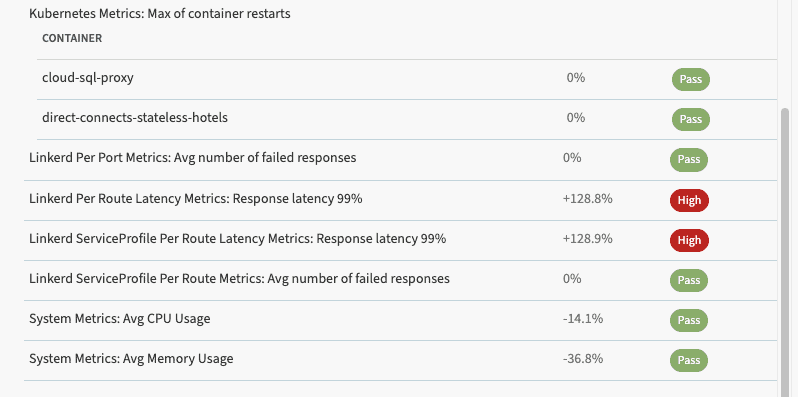
Since their Linkerd adoption, the team has implemented canary deployments with automated rollbacks in case of failure, combining Argo Rollouts and Kayenta and metrics provided by Linkerd. Each new deployment will create 10% of pods using the new image. Linkerd metrics captured from the new and old pods are used to perform statistical analysis and identify issues before the new version is promoted to stable. This means if, for example, an application’s P95 response time increases by a certain percentage compared to the previous stable version, they can consider it a failed deployment and rollback automatically.

Williams and team caught hundreds of failed deployments with this approach, significantly reducing their MTTD and incident response time. Oftentimes, issues that would have become full-scale production outages are caught and rolled back long before they would have been caught by an engineer. This type of metrics-based analysis is only possible when application data is collected consistently.
The platform team has also built automated latency and success SLIs and SLOs based on Linkerd metrics, using a combination of open-source tools: Pyrra and Sloth.
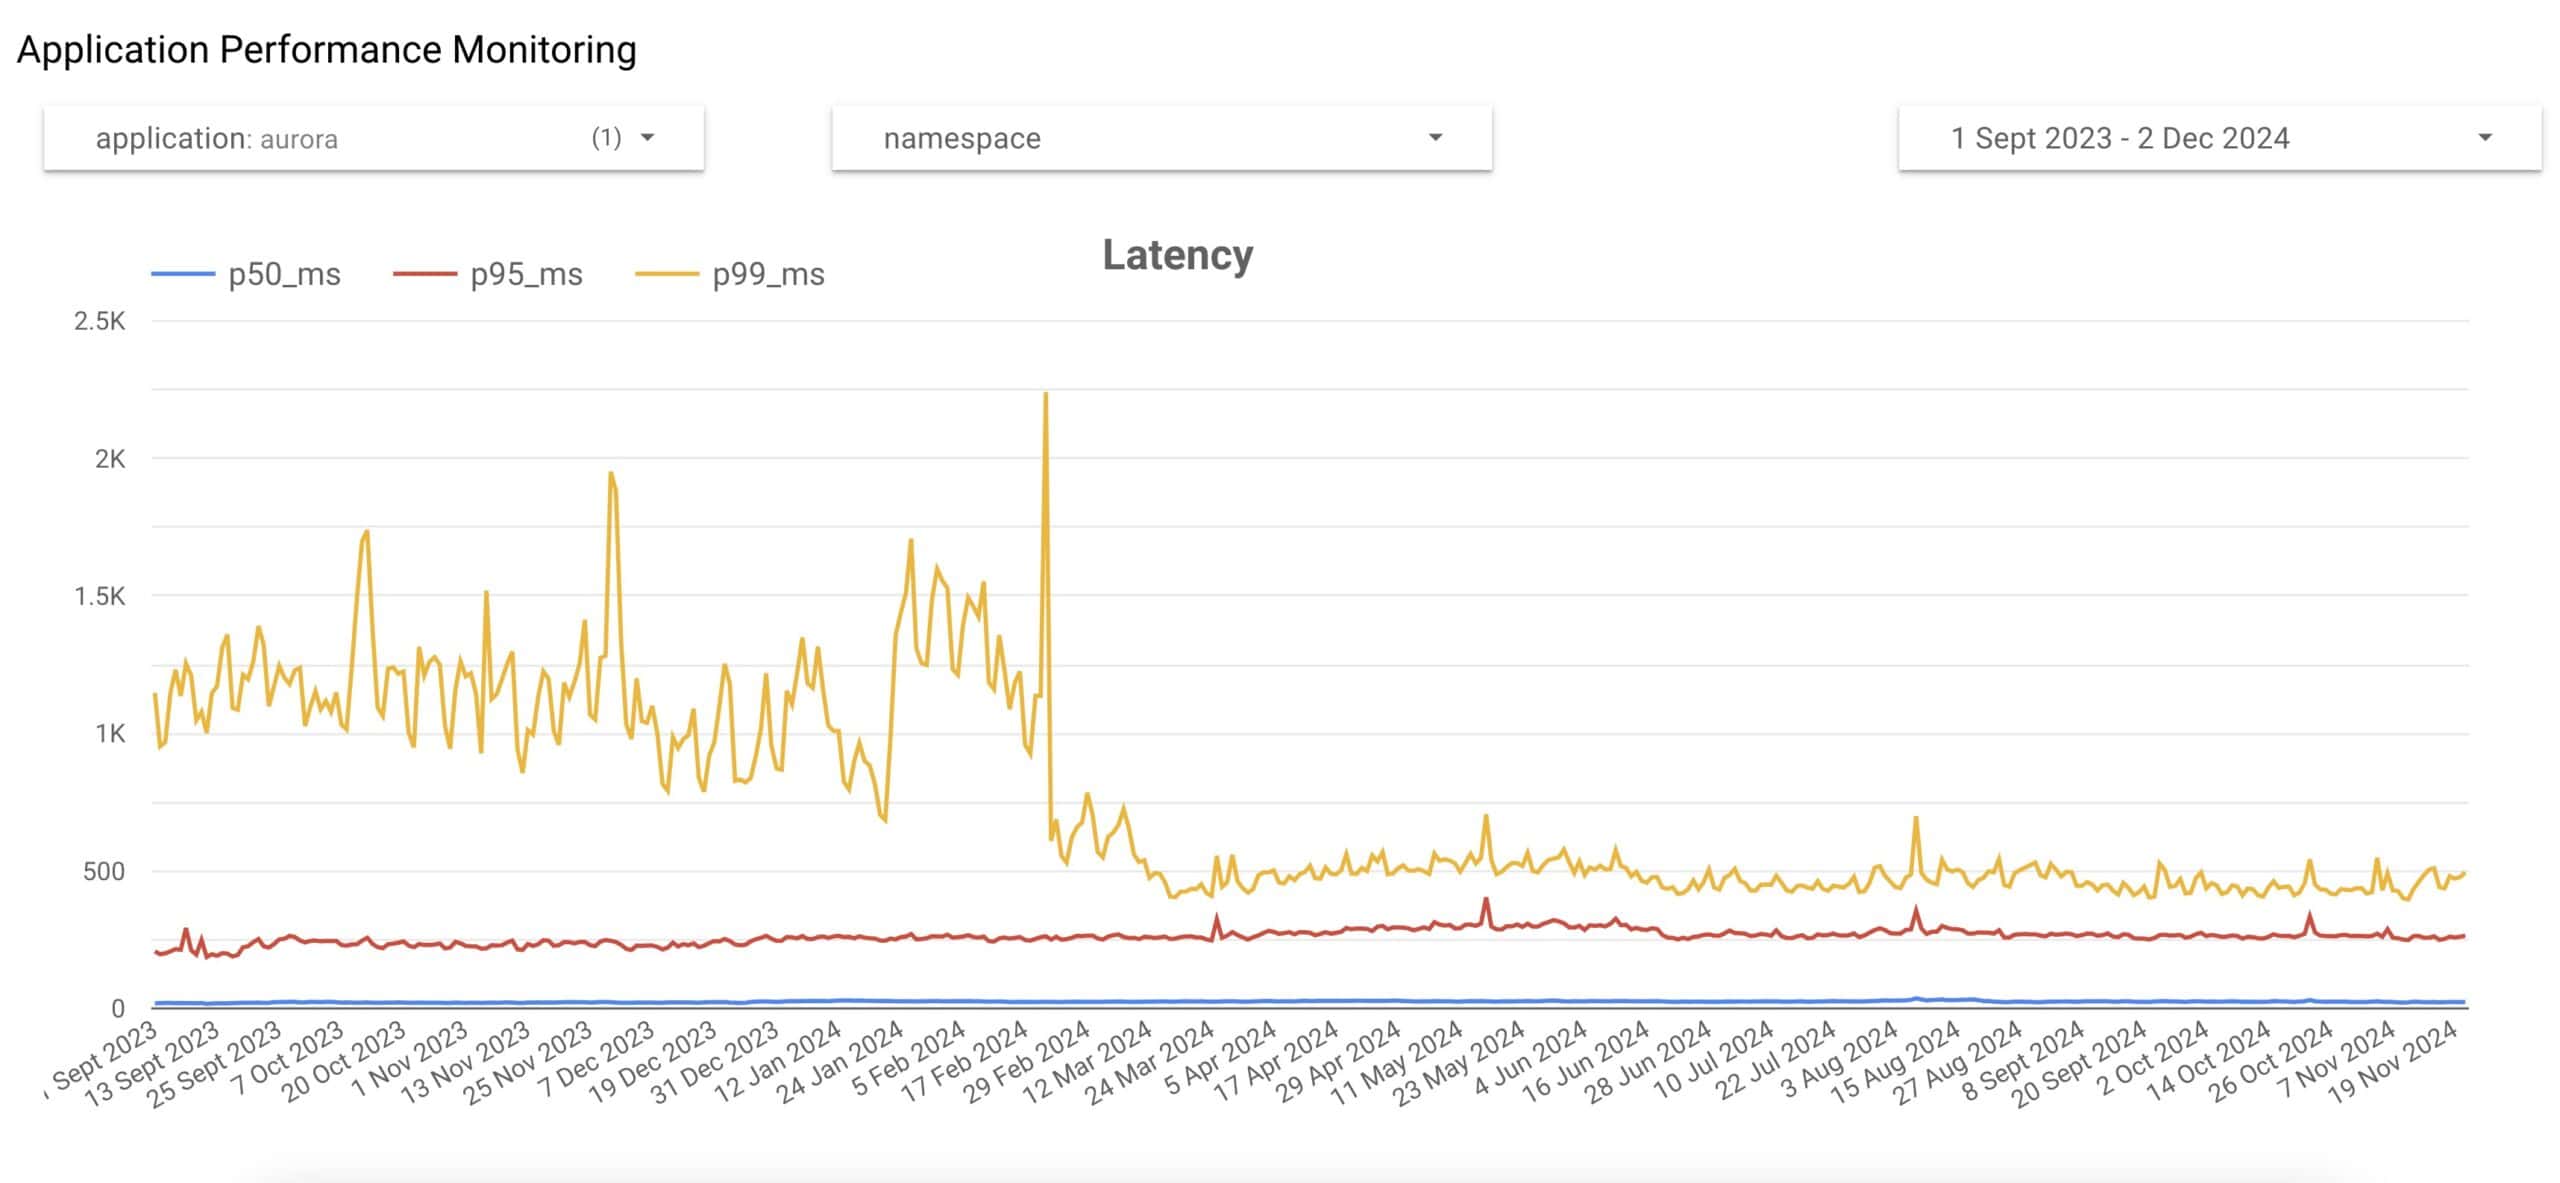
One more use case we’ll share in this case study is how loveholidays exports all Linkerd metrics to BigQuery. An Application Performance Monitoring dashboard shows latency and RPS for all applications since collecting Linkerd metrics. This is very useful for identifying regressions (or improvements, as shown below!) over time:

Of course, Linkerd offers much more than just metrics. While the platform team has been able to use these features in other areas, Williams says they are barely scratching the surface of what is possible. They’ve used Service Profiles to define Retries and Timeouts at the Service level, making automatically retryable endpoints a uniform configuration and allowing them to shift this logic out of application code.
With Linkerd’s new advances in HTTPRoutes, Williams looks forward to exploring new features like Traffic Splitting and Fault Injection to enhance their service mesh usage further. (To learn more about loveholidays’ experience using Linkerd for monitoring, read the Linkerd at loveholidays — Monitoring our apps using Linkerd metrics blog post.)
Achieving metrics nirvana.. and increasing the conversion rate by 2.61%
A great user journey is at the heart of everything loveholidays does. Fast search is crucial to their customers’ holiday browsing experience and directly correlates with customer conversion rate. A refactor of their internal content repository tooling with a decreased P95 search time resulted in a 2.61% increase in conversion, based on a 50% traffic split A/B test.
“Based on the numbers published in the atol report and considering that loveholidays flew nearly three million passengers in 2023, an additional ~75,000 passengers traveled with us as a result of a faster search, all monitored and powered with the metrics produced by the Linkerd proxy.”
Dan Williams
We love holidays and CNCF projects!
Everyone at loveholidays is a big open-source fan, and as such, they use many CNCF projects. Let’s have a quick overview of their current CNCF stack.
At the core of it all is, of course, Kubernetes. All their production applications are hosted in Google Kubernetes Engine, with Gateway API used for all ingress traffic. Recently, they migrated from Flux to Argo CD, which they use as their GitOps controller with Kustomize and Helm to deploy manifests. For canary analysis and automated rollbacks, they use Argo Rollouts, Kayenta, and Spinnaker — all powered by Linkerd metrics. They have also developed an in-house “common” Helm chart, powering all applications and ensuring consistent labels and resources across applications.
Some workloads use KEDA to scale pods based on GCP’s Pub/Sub and/or RabbitMQ. They have processes that dump thousands of messages at once into a Pub/Sub Queue, and KEDA scales up hundreds of pods at a time to rapidly handle the load.
They use Conftest / OPA as part of their Kubernetes and Terraform pipelines, enabling them to enforce best practices as a platform team (check out Enforcing best practice on self-serve infrastructure with Terraform, Atlantis and Policy As Code for more details).
Secrets are stored in Hashicorp Vault, with Vault Secret Operator for Cluster integration.
Built with Grafana’s Mimir, Grafana, Prometheus, Loki, and Tempo, the engineering team’s monitoring system is fully open-source. They use the prometheus-operator with kube-stack-prometheus, and OpenTelemetry to collect distributed tracing with otel-collector and Tempo, and Pyroscope for Application Performance Monitoring.
Known internally as Devportal, loveholidays uses Backstage to keep track of services as an internal service catalog. They tied Backstage “service” resources into their common Helm chart to ensure every deployment inside Kubernetes has a Backstage / Devportal reference, with quick links to the GitHub repository, logs, Grafana dashboards, Linkerd Viz, and so on.
Velero is used for cluster backups, Trivy to scan container images, Kubeconform as part of the CI pipelines for K8s manifest validation.
A combination of cert-manager and Google-managed certificates, both using Let’s Encrypt, power loveholidays’ certificates, and external-DNS automates DNS record creation via Route53. They use cert-manager to generate the full certificate chain for Linkerd, which is the third part of our Linkerd blog series – Linkerd at loveholidays — Deploying Linkerd in a GitOps world.
