Join our daily and weekly newsletters for the latest updates and exclusive content on industry-leading AI coverage. Learn More
Marketing-driven revenue from mobile apps has grown 80 percent since 2016, according to a new report from mobile attribution and marketing analytics firm AppsFlyer and Facebook.
The report cites an increasingly competitive market and dwindling rates of retention — the ability for an app to hang onto users — as having pushed app marketers to rely more on data to measure and optimize revenue.
And when it comes to game marketing, the report has some important lessons. Though less than 4 percent of gamers actually make in-app purchases, those users are key to profitability for app makers. For gaming app marketers, that group represents the reason user acquisition is all about quality in all markets. Not only is the average revenue from paying gamers 40 times higher than the average among all gamers, their growth rate only climbs over time.
AppsFlyer looked at customer and mobile user lifetime value (LTV) — with fresh insights on app user engagement, revenue generation, and purchasing decisions — for key verticals (including shopping, travel, and gaming) across key global markets. The report analyzed 250 million nonorganic installations of apps and $2.4 billion in revenue generated by 3,800 apps in the first quarter of 2018.
There are significant differences in marketing performance between gaming, shopping, and travel markets. The performance gap between iOS and Android and between organic and nonorganic traffic (nonorganic refers to traffic that comes from ads) is much smaller in gaming than it is in shopping and travel apps.
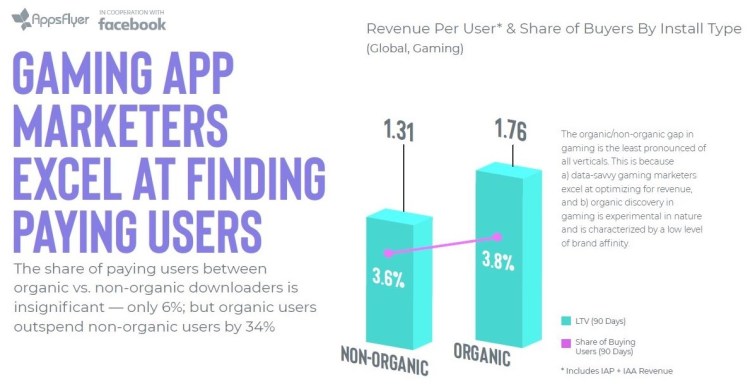
In gaming, revenue from an average iOS user is only 28 percent higher than from an Android user, compared to a 70 percent and 60 percent higher spend in shopping and travel, respectively. The share of paying users in gaming is only 6 percent higher for organic users compared with 25 percent higher and no less than 170 percent higher for travel and shopping, respectively. A key reason for this significant gap is the much heavier use of data among gaming app marketers.
The organic/nonorganic gap in gaming is smaller than in the other verticals. This is because data-savvy gaming marketers excel at optimizing for revenue, and brand affinity in organic discovery in gaming is relatively low.
Because revenue generated in the first week is significant, and then mostly drops off, effective messaging at the right time is key, the report said.
Over 30 percent of paying gamers make more than three purchases within a 90-day period, which represents a significant sum. Re-engaging the 2- or 3-time purchasers can increase this number even further.
For overall apps, the United States and the United Kingdom are in a league of their own in revenue generation, but there is potential for growth in emerging markets. The value generated by in-app consumers in more mature U.S. and U.K. markets is significantly higher than in the other markets examined.

Above: Marketing-driven app revenue is up 80 percent since 2016.
However, competition in U.S. and U.K. markets is fierce, and the cost of media is much higher. In emerging markets like Indonesia, India, and Brazil, improved revenue optimization could lead to better growth in profitability, thanks to a lower cost of media.
AppsFlyer advised marketers to time re-engagement campaigns so that they match the LTV curve for revenue growth.
When there’s a decline in revenue, marketers should run re-engagement campaigns across paid and owned channels, the report said. Encouraging ongoing usage with effective revenue-related messaging (such as 10 percent off a user’s next purchase) can help apps generate more business from the average user.
And the report said that connecting cost to revenue is essential in determining the bottom line. App marketers should connect cost to LTV to determine return on ad spend (ROAS). In AppsFlyer’s recent AppsFlyer Performance Index, the company found that in both gaming and non-gaming categories, high revenue has a stronger correlation with ROAS than a low cost per install (CPI). That means marketers should pay attention to both metrics, but revenue optimization comes first.

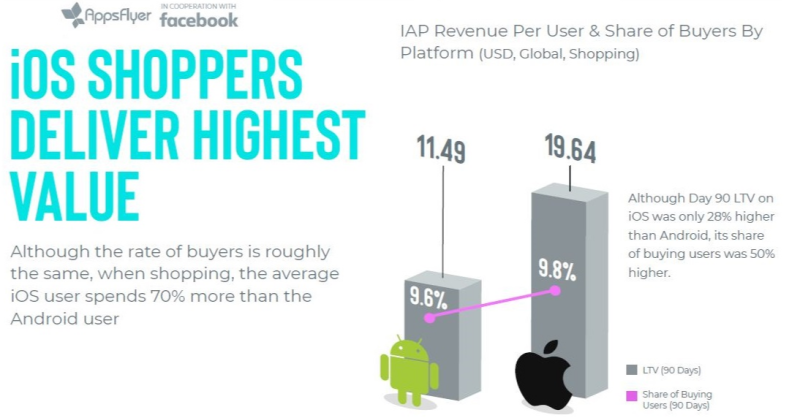
Above: iOS delivers the highest value in shopping apps.
When it comes to shopping apps, the report said consumers who shop with iOS devices are far more active, with 70 percent higher average revenue than Android shoppers. However, Android scale is far too large to ignore, and Android users are active shoppers, as their share of paying consumers indicates — almost the same as iOS, at 9.6 percent. By targeting high-end Android devices, marketers can increase the LTV from this platform.
When it comes to travel, running more campaigns will increase the number of organic installs, and a travel app generates significant value from an organic user. There is always a lift in organic installs when campaigns are running (although at a much lower rate than two to three years ago). This increase in organic installs as a result of marketing activity will also boost LTV.


