Use a table chart to turn a spreadsheet table into a chart that can be sorted and paged.
Learn how to add & edit a chart.
How to format your data
Columns: Enter numeric data or text. Data within each column must be the same type.
Tip: To sort the table, click on a column header in the chart.
Examples
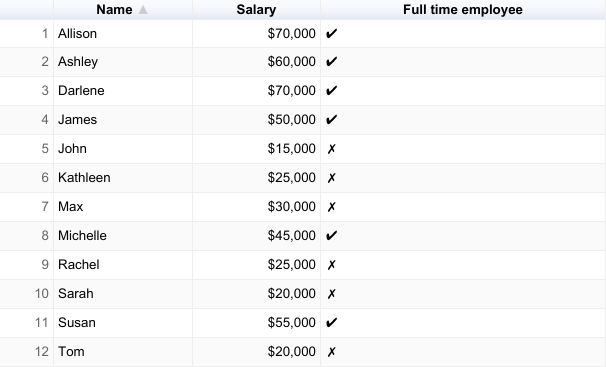
Employee salaries

| Name | Salary | Full time employee |
|---|---|---|
| Ashley | $60,000 | ✔ |
| Tom | $20,000 | ✗ |
| James | $50,000 | ✔ |
| Michelle | $45,000 | ✔ |
| Susan | $55,000 | ✔ |
| John | $15,000 | ✗ |
| Kathleen | $25,000 | ✗ |
| Darlene | $70,000 | ✔ |
| Max | $30,000 | ✗ |
| Allison | $70,000 | ✔ |
| Sarah | $20,000 | ✗ |
| Rachel | $25,000 | ✗ |
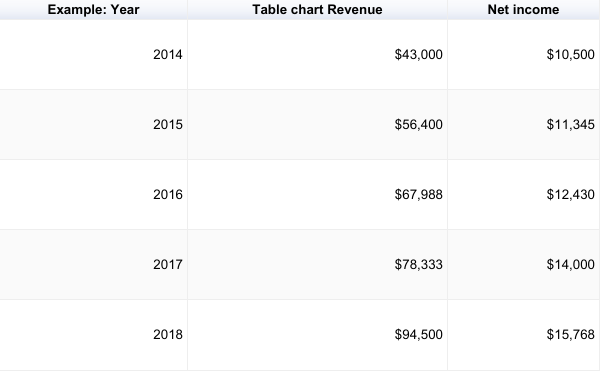
Annual revenue & net income

| Year | Revenue | Net income |
|---|---|---|
| 2014 | $43,000 | $10,500 |
| 2015 | $56,400 | $11,345 |
| 2016 | $67,988 | $12,430 |
| 2017 | $78,333 | $14,000 |
| 2018 | $94,500 | $15,768 |
Customize a table chart
- On your computer, open a spreadsheet in Google Sheets.
- Double-click the chart you want to change.
- At the right, click Customize
Table.
- Change how the table looks, sort the table, or add pagination.