opensource.google.com

Menu
Showing posts with label GCP. Show all posts

The Kubernetes ecosystem is a candy store

Monday, June 3, 2024


For the 10th anniversary of Kubernetes, I wanted to look at the ecosystem we created together.

I recently wrote about the pervasiveness and magnitude of the Kubernetes and CNCF ecosystem. This was the result of a deliberate flywheel. This is a diagram I used several years ago:

Flywheel diagram of Kubernetes and CNCF ecosystem

Because Kubernetes runs on public clouds, private clouds, on the edge, etc., it is attractive to developers and vendors to build solutions targeting its users. Most tools built for Kubernetes or integrated with Kubernetes can work across all those environments, whereas integrating directly with cloud providers directly entails individual work for each one. Thus, Kubernetes created a large addressable market with a comparatively lower cost to build.

We also deliberately encouraged open source contribution, to Kubernetes and to other projects. Many tools in the ecosystem, not just those in CNCF, are open source. This includes many tools built by Kubernetes users and tools built by vendors but were too small to be products, as well as those intended to be the cores of products. Developers built and/or wrote about solutions to problems they experienced or saw, and shared them with the community. This made Kubernetes more usable and more visible, which likely attracted more users.

Today, the result is that if you need a tool, extension, or off-the-shelf component for pretty much anything, you can probably find one compatible with Kubernetes rather than having to build it yourself, and it’s more likely that you can find one that works out of the box with Kubernetes than for your cloud provider. And often there are several options to choose from. I’ll just mention a few. Also, I want to give a shout out to Kubetools, which has a great list of Kubernetes tools that helped me discover a few new ones.

For example, if you’re an application developer whose application runs on Kubernetes, you can build and deploy with Skaffold, test it on Kubernetes locally with Minikube, or connect to Kubernetes remotely with Telepresence, or sync to a preview environment with Gitpod or Okteto. When you need to debug multiple instances, you can use kubetail to view the logs in real time.

To deploy to production, you can use GitOps tools like FluxCD, ArgoCD, or Google Cloud’s Config Sync. You can perform database migrations with Schemahero. To aggregate logs from your production deployments, you can use fluentbit. To monitor them, you have your pick of observability tools, including Prometheus, which was inspired by Google’s Borgmon tool similar to how Kubernetes was inspired by Borg, and which was the 2nd project accepted into the CNCF.

If your application needs to receive traffic from the Internet, you can use one of the many Ingress controllers or Gateway implementations to configure HTTPS routing, and cert-manager to obtain and renew the certificates. For mutual TLS and advanced routing, you can use a service mesh like Istio, and take advantage of it for progressive delivery using tools like Flagger.

If you have a more specialized type of workload to run, you can run event-driven workloads using Knative, batch workloads using Kueue, ML workflows using Kubeflow, and Kafka using Strimzi.

If you’re responsible for operating Kubernetes workloads, to monitor costs, there’s kubecost. To enforce policy constraints, there’s OPA Gatekeeper and Kyverno. For disaster recovery, you can use Velero. To debug permissions issues, there are RBAC tools. And, of course, there are AI-powered assistants.

You can manage infrastructure using Kubernetes, such as using Config Connector or Crossplane, so you don’t need to learn a different syntax and toolchain to do that.

There are tools with a retro experience like K9s and Ktop, fun tools like xlskubectl, and tools that are both retro and fun like Kubeinvaders.

If this makes you interested in migrating to Kubernetes, you can use a tool like move2kube or kompose.

This just scratched the surface of the great tools available for Kubernetes. I view the ecosystem as more of a candy store than as a hellscape. It can take time to discover, learn, and test these tools, but overall I believe they make the Kubernetes ecosystem more productive. To develop any one of these tools yourself would require a significant time investment.

I expect new tools to continue to emerge as the use cases for Kubernetes evolve and expand. I can’t wait to see what people come up with.

By Brian Grant, Distinguished Engineer, Google Cloud Developer Experience

Introducing the Open Source Insights Project

Thursday, June 3, 2021

Open Source Insights

Google has been working on software supply-chain security for many years, and transitive dependencies remain one of the most complex and least understood aspects. While we will be integrating this data into our Cloud and internal products in a variety of ways, we believe there is an immediate value in helping developers understand and visualize dependencies. Today, we are excited to share an exploratory visualization site: Open Source Insights, which provides an interactive view of the dependencies of open source projects.

Software development practices have evolved significantly over the last few years. Collaborative development with distributed feature development, consumption of open source and third-party packages, and publicly maintained software libraries have become commonplace, partly as a result of the widespread use of open source software. The advantages of open source are so clear that people and companies that would once have rejected OSS are now adopting it as a critical element of their environment.

But there are challenges brought by OSS too. The pace of change is electric, and it can be hard to keep up. The software packages that a large project depends on might update too frequently to keep a clear picture of what is happening. And those packages, in turn, can change their dependencies to provide new features or fix bugs. Security problems and other issues can arise unexpectedly in your project as a result, and the scale of the problem can make it all difficult to manage. Even a modest OSS project might depend on hundreds of packages.

There are tools to help, of course: vulnerability scanners and dependency audits that can help identify when a package is exposed to a vulnerability. But it can still be difficult to visualize the big picture, to understand what you depend on, and what that implies.

Open Source Insights provides a visualization of a project’s dependencies and their properties. Our exploratory website can be used to get an overview of how a particular software package is put together. Among other features, it provides interactive tools to visualize and analyze full, transitive dependency graphs. It also has a comparison tool to highlight how different versions of a package might affect your dependencies, perhaps by changing their own dependencies, adding licensing requirements, or fixing security problems.

Dependency graph for express 4.17.1

Open Source Insights shows you all this information about a package without asking you to install the package first. You can see instantly what installing a package—or an updated version—might mean for your project, how popular it is, find links to source code and other information, and then decide whether it should be installed. Insights also helps you see the importance of your project by showing the projects that depend on it: its dependents. Even a small project is important if a large number of other projects depend on it, either directly or through transitive dependencies.

Open Source Insights continuously scans millions of projects in the open source software ecosystem, gathering information about packages, including licensing, ownership, security issues, and other metadata such as download counts, popularity signals, and OpenSSF Scorecards. It then constructs a full dependency graph—transitively tracking dependencies, dependencies' dependencies, and so on—and incorporates the metadata, then publishes it so you can see how it all might affect your software. And the information it provides is continually updated.
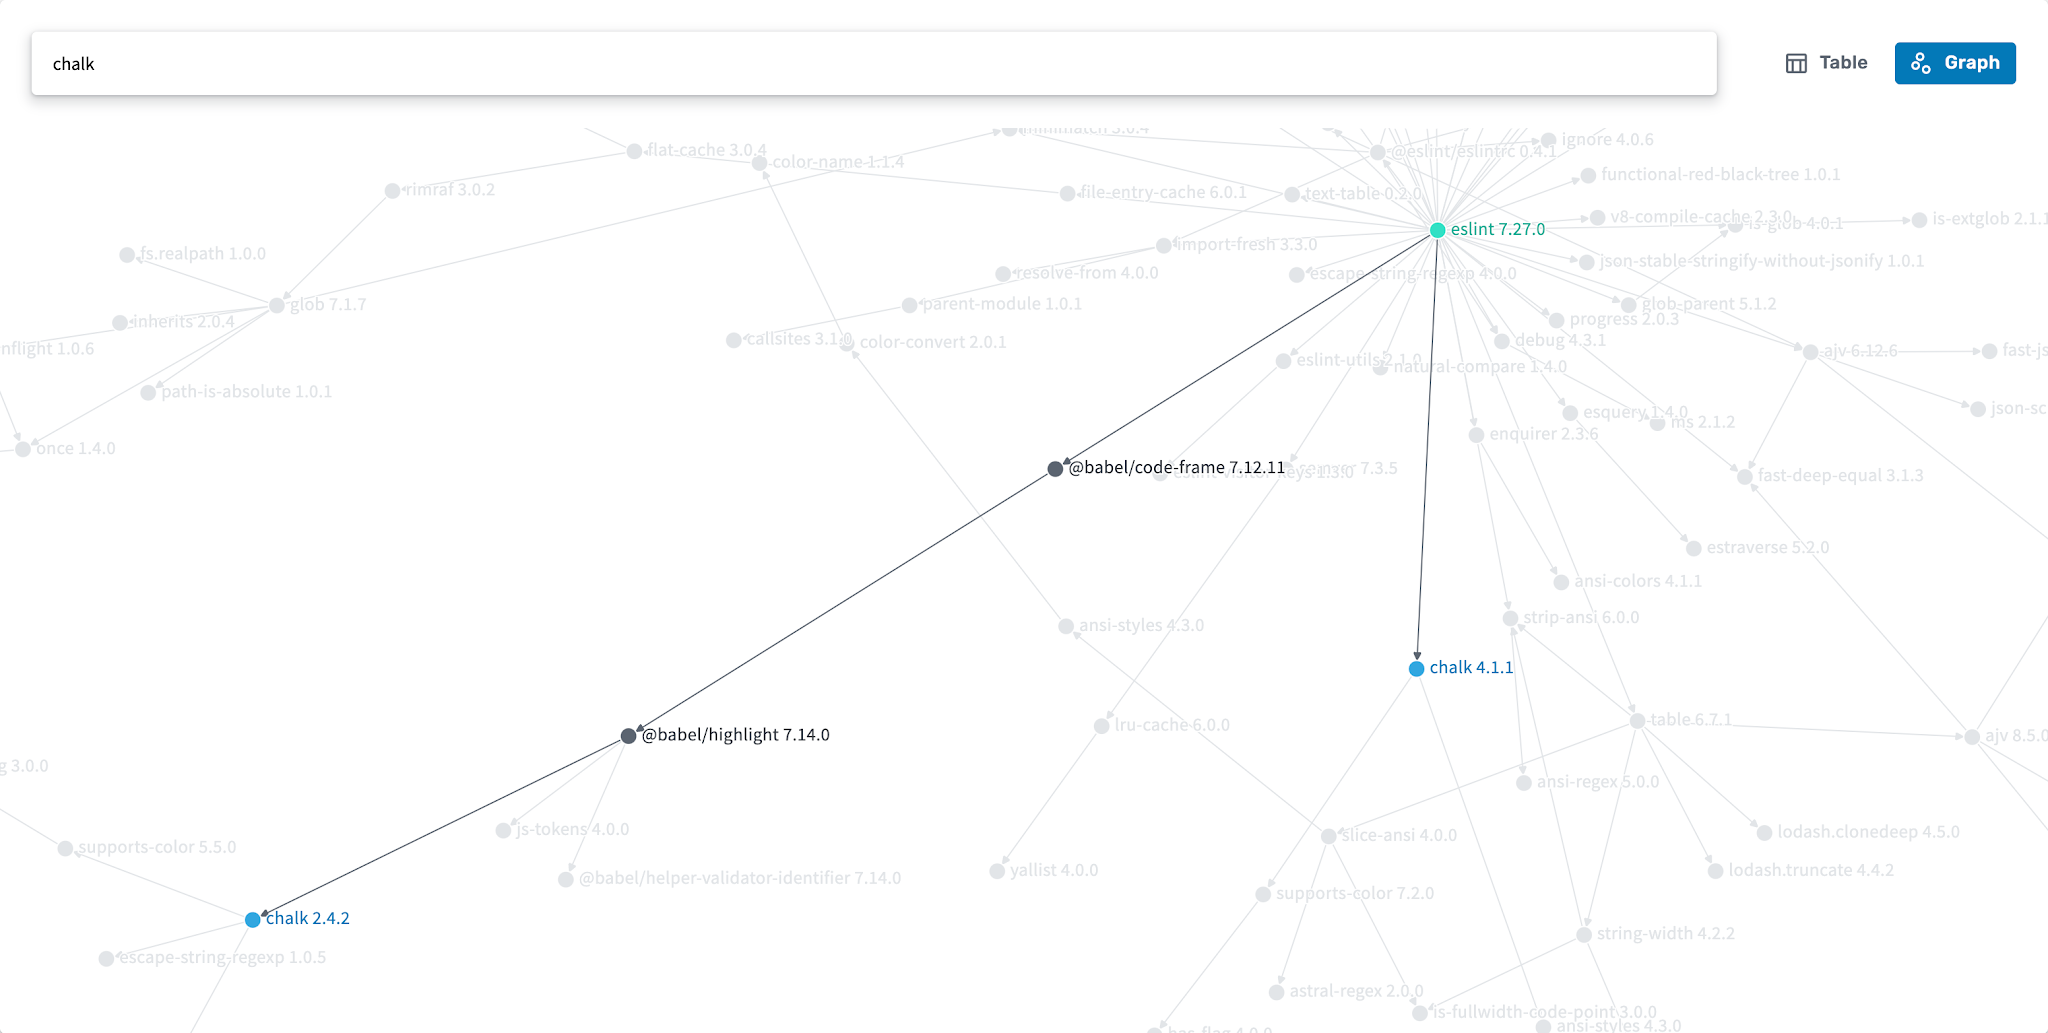
Filtered dependency graph showing how eslint 7.27.0 depends on chalk 2.4.2 and 4.1.1

Filtered dependency graph showing how eslint 7.27.0 depends on chalk 2.4.2 and 4.1.1

This information can help visualize how software is put together, whether an update is worth doing, or how to fix a problem.

Today, Open Source Insights supports npm, Maven, Go modules, and Cargo. While we work on adding additional packaging systems, we want to hear from you: How could this data fit into your development workflow? What would make it more useful? You can reach the team at deps.dev to share your thoughts; we’ll be collecting feedback for the upcoming months and look forward to hearing your ideas on how best to improve supply-chain security.

Visit our website at deps.dev to try it out.

From the Google Cloud team: What this means for GCP’s open cloud

For users of open source software, this may be the first time you’re seeing dependency and vulnerability information in an organized and accessible way. If you’re using a managed service based on open source, it’s important to remember that you may not be affected by all vulnerabilities listed. Your provider may have taken steps to harden the products you use, and when a new vulnerability is disclosed, your provider may take responsibility for patching this on your behalf.

Google Cloud follows both these steps to help users get the benefits of open cloud while prioritizing security. Multiple layers of hardening create defense-in-depth, which helps protect services like Google Kubernetes Engine (GKE), Cloud Run and Cloud Functions from a container escape vulnerability. For components that are the user’s responsibility, we’re constantly rolling out new services—like GKE Autopilot—that automate these responsibilities.

We’re committed to protecting our customers, both through our patch rewards program and the recently launched cyber insurance partnership, the Risk Protection Program, which moves from shared responsibility to shared fate. We look forward to bringing our customers new information on their open source dependencies.

By Andrew Gerrand, Michael Goddard, Rob Pike and Nicky Ringland of the Open Source Insights Team

OpenTelemetry's First Release Candidates

Wednesday, October 21, 2020

OpenTelemetry has hit another milestone with the tracing specification reaching release candidate status.

With the specification now ready to go, expect to see tracing release candidates of the official APIs and SDKs over the next few weeks, along with updated exporters for Cloud Trace. In the coming months the same will follow for the metrics specification, followed by metrics release candidates of the APIs and SDKs and Cloud Monitoring exporters, followed by the project’s general availability. At this point we’ll switch our default application metrics and distributed tracing instrumentation from OpenCensus to OpenTelemetry.

This is exciting news for Google Cloud customers, as OpenTelemetry will enable even better observability experiences, both with Cloud Monitoring and Cloud Trace, or the third party monitoring and operations tools of your choice.

Originally posted on the on the OpenTelemetry blog.


Recreating historical streetscapes using deep learning and crowdsourcing

Tuesday, September 15, 2020

For many, gazing at an old photo of a city can evoke feelings of both nostalgia and wonder. We have Google Street View for places in the present day, but what about places in the past? What was it like to walk through Manhattan in the 1940s? To create a rewarding “time travel” experience for both research and entertainment purposes, Google Research is launching Kartta Labs, an open source, scalable system on Google Cloud and Kubernetes that tackles the difficult problem of reconstructing what cities looked like in the past from scarce historical maps and photos.

Kartta Labs consists of three main parts:
  • A temporal map server, which shows how maps change over time;
  • A crowdsourcing platform, which allows users to upload historical maps of cities, georectify, and vectorize them (i.e. match them to real world coordinates);
  • And an upcoming 3D experience platform, which runs on top of maps creating the 3D experience by using deep learning to reconstruct buildings in 3D from limited historical images and maps data.

Maps & Crowdsourcing

Kartta Labs is a growing suite of open source tools that work together to create a map server with a time dimension, allowing users to populate the service with historically accurate data.
gif of editor in use

Warper

The entry point to crowdsourcing is Warper, an open source web app based on MapWarper that allows users to upload historical images of maps and georectify them by finding control points on the historical map and corresponding points on a base map.

Once a user uploads a scanned historical map, Warper makes a best guess of the map’s geolocation by extracting textual information from the map. This initial guess is used to place the map roughly in its location and allow the user to georeference the map pixels by placing pairs of control points on the historical map and a reference map. Given the georeferenced points, the application warps the image such that it aligns well with the reference map.

Warper runs as a Ruby on Rails application using a number of open source geospatial libraries and technologies, including but not limited to PostGIS and GDAL. The resulting maps can be exported in PNG, GeoTIFF, and other open formats. Warper also runs a raster tiles server that serves each georectified map at a tile URL. This raster tile server is used to load the georectified map as a background in the Editor application that is described next.

Editor

Editor is an open source web application which is a customized version of the OpenStreetMap editor; customizations include support for time dimension and integration with the other tools in the Kartta Labs suite. Editor allows users to load the georectified historical maps and trace their geographic features (e.g., building footprints, roads, etc.). This traced data is stored in vector format.

Extracted geometries in vector format, as well as metadata (e.g., address, name, and start or end dates), are stored in a geospatial database that can be queried, edited, styled, and rendered into new maps.

Kartta

Finally, the temporal map front end, Kartta (based on Tegola), visualizes the vector tiles allowing the users to navigate historical maps in space and time. Kartta works like any familiar map application (such as Google Maps), but also has a time slider so the user can choose the year at which they want to see the map. By moving the time slider, the user is able to see how features in the map, such as buildings and roads, changes over time.

3D Experience

To actually create the “time traveling” 3D experience, the forthcoming 3D Models module aims to reconstruct the detailed full 3D structures of historical buildings. The module will associate images with maps data, organize these 3D models properly in one repository, and render them on the historical maps with a time dimension.

Preliminary Results

Figure 2 – Bird’s eye view of 3D-reconstructed  Chelsea, Manhattan with a time slider
Figure 3 – Street level view of 3D-reconstructed Chelsea, Manhattan

Conclusion

We developed the tools outlined above to facilitate crowdsourcing and tackle the main challenge of insufficient historical data. We hope Kartta Labs acts as a nexus for an active community of developers, map enthusiasts, and casual users that not only utilizes our historical datasets and open source code, but actively contributes to both. The launch of our implementation of the Kartta Labs suite is imminent—keep an eye out on the Google AI blog for that announcement!

By Raimondas Kiveris – Google Research

W3C Trace Context Specification: What it Means for You

Wednesday, December 11, 2019

Since the first days of Google Cloud Platform (GCP), Google has been at the forefront of making your applications more observable. Beyond Stackdriver, our most visible impact in this space is OpenTelemetry, which we initiated in 2017 (as OpenCensus) and has grown into a huge community that includes the majority of APM / monitoring vendors and cloud platforms.

While OpenTelemetry allows developers to easily capture distributed traces and metrics from their own services, there’s also a need to trace requests as they propagate through components that developers don’t directly control, like managed services, load balancers, network hardware, etc. To solve this we co-defined a prototype HTTP header that these components can rely on, gathered partners, and moved the work into the W3C.

This work is now complete, and the W3C Trace Context format is now an official standard. Once implemented in GCP, this will make our services even easier to manage, both with Stackdriver and other third party distributed tracing tools. We explain more in the
official post on the W3C blog, which I’ve copied below:

The W3C Distributed Tracing working group has moved the Trace Context specification to the next maturity level. The specification is already being adopted and implemented by many platforms and SDKs. This article describes the Trace Context specification and how it improves troubleshooting and monitoring of modern distributed apps.

W3C Trace Context specification defines the format for propagating distributed tracing context between services. Distributed tracing makes it easy for developers to find the causes of issues in highly-distributed microservices applications by tracking how a single interaction was processed across multiple services. Each step of a trace is correlated through an ID that is passed between services, and W3C Trace Context now defines a standard for these context propagation headers.

Until now, different tracing systems have defined their own headers. Examples include Zipkin’s B3 format and X-Google-Cloud-Trace. Adopting a common context propagation format has been long desired by developers, APM vendors, and cloud platform hosts, as compatibility provides numerous benefits:
  • Web and RPC frameworks that use this standard to provide context propagation out of the box will also offer cross-service log correlation, even for developers who haven’t set up distributed tracing.
  • API producers can record the trace IDs of requests from API consumers and provide additional spans or metadata to their customers for a given traced request. Producers can also correlate customer trace IDs to internal traces when debugging technical issues raised by consumers.
  • Networking infrastructure (proxies, load balancers, routers, etc.) can both ensure that context propagation headers are not removed from requests passing through them, and can record spans or logs for a given trace, without having to support multiple vendor-specific formats. Potential examples of these include router appliances, cloud load balancers, and sidecar proxies like Envoy.
  • Instrumentation can be further decoupled from a developer’s choice of APM vendor. For example, using both OpenTelemetry and a given vendor’s agents, a developer can instrument different services in an application, and traces will flow through the system and be processed correctly by the vendor’s backend.
  • Web browsers and other clients can use these identifiers to correlate their telemetry with traces collected from backend services. This functionality is currently being defined.
To address this effort, a group of cloud providers, open source contributors, and APM vendors started defining a standard HTTP context propagation header that would replace their homegrown formats. This specification has been discussed and iterated on over the past two years, and the group working on it has grown significantly over that time. Sponsors include Google, Microsoft, Dynatrace, and New Relic (W3C members), and the group was officially moved into the W3C in 2018 for the work to proceed under the guidance of an official standards body and to spur even greater adoption.

TraceContext has since been adopted by OpenTelemetry (which enables it by default and also serves as the reference implementation), Azure services, Dynatrace, Elastic, Google Cloud Platform, Lightstep, and New Relic. We are tracking adoption in this list.

This first phase of work has focused on HTTP, as it is commonly used and has no built-in affordances for trace context propagation (gRPC and some newer RPC systems do). The same group of committee members are also working to define trace context propagation in other formats, starting with AMQP and MQTT for IoT; other upcoming topics include context propagation from clients and web browsers.

By Morgan McLean, OpenTelemetry + Stackdriver
.