


Abstract
2015 saw the strongest El Niño event in the historical record, resulting in extreme drought conditions in Brazil. As drought conditions may also lead to greater fire danger, this study uses the 2015 fire in Brazil as a case study to examine whether and to what extent human-induced climate change has contributed to the fire weather conditions in the Cerrado and the southern Amazonia transitional forests known as the Arc of deforestation. Our results show that anthropogenic climate change is indeed a driver of meteorological conditions conducive to strong fire weather in these two regions, measured by fire weather index (FWI), especially on shorter timescales of daily and weekly. The anthropogenic climate change signal of FWI on short timescales corresponds to a similar order of increase in the FWI sub-indices (initial spread index and fine fuel moisture code) that can rapidly change due to the influence of the instantaneous weather conditions. For both regions the changes in fire weather in response to anthropogenic climate change are dominated by the combination of temperature and relative humidity responses. High FWI is more likely to occur under El Niño conditions, less likely under La Niña conditions, although the impacts of El Niño vs La Niña conditions are not symmetric when compared with El Niño Southern Oscillation neutral states. To summarize, both human-induced climate change and the presence of El Niño increased the likelihood of occurrence for the strong fire weather condition in 2015. Our results suggest that local and regional adaptation measures, such as improved drought monitoring and warning systems, could help with effective planning of fire prevention, firefighting actions, and disaster preparedness.
Export citation and abstract BibTeX RIS

Original content from this work may be used under the terms of the Creative Commons Attribution 4.0 license. Any further distribution of this work must maintain attribution to the author(s) and the title of the work, journal citation and DOI.
1. Introduction
Although fire ignitions largely originate from human activities, climate and weather can be key factors of the spread and growth of fires (Barbero et al 2015). The influence of climate and weather on fire occurrences has been widely discussed in the literature, especially regarding the impacts on various timescales (Flannigan et al 2000, Riley et al 2013, Amraoui et al 2015, Barbero et al 2015, Gouveia et al 2016, Ruffault et al 2016, 2018, 2020). At annual to seasonal timescales, the climate conditions are essential to the production of biomass, and following that the drying of fuels; whereas on short timescales, weather conditions could significantly influence fire ignition (e.g. lightening, Pivello et al 2011), fuel moisture, growth in intensity, and potential for spread (Barbero et al 2015, Ruffault et al 2017, 2020). There are many other factors that play important roles in fire activity, including but not limited to, the species of vegetation on the ground, access to roads and rivers, local fire-fighting strategies, etc. The occurrence and behavior of fires are also affected by human-related factors, such as ignitions, local practices such as controlled burning and/or fire suppression efforts, and clearing the landscape for agriculture and commercial use, which in turn are affected by various political and socioeconomic factors (Moreira et al 2020 and references within). Fire activities tend to increase in drought years (Swetnam and Anderson 2008, Aragão et al 2018, Barbosa et al 2019, Silva Junior et al 2019), and some previous studies already show climate models projections (Cox et al 2008, Malhi et al, 2009, Duffy et al 2015) of increased intensity during dry seasons and extreme dry events in Brazil. Hence, increased fire weather danger due to anthropogenic warming, through increased drought frequency, has the potential to exceed the capabilities of current fire management strategies (Flannigan et al 2009), sometimes to the extent of needing a paradigm shift (Moreira et al 2020). The observed changes in fire activity over recent decades in Brazil (Aragão et al 2018) underscores the need for a better understanding of the relationship between meteorological conditions favorable for wildfires (i.e. fire weather conditions), natural climate variability, drivers outside the climate system (ignition causes, fire management, etc), and the role of anthropogenic climate change. This is needed for developing reliable fire models to improve projections of fire activities and shifting fire regime patterns, and to better support local fire management policies. However, there is no existing body of literature that specifically focuses on human-induced climate change impacts on fires in Brazil.
Following an extreme event (fire or any other kind), the attribution question arises: whether and to what extent human-induced climate change contributed to the event? While it is not possible to disentangle and quantify all these complex human dimensions, with the well-established event attribution methodology (Otto 2017, Philip et al 2020 and the references within), it is possible to investigate whether and to what extent human-induced climate change has contributed to changes in weather and climate conditions. Such methods have been applied to recent extreme events, many of which appear in the Annual reports of the Bulletin of the American Meteorological Society on explaining extreme events of the previous year from a climate perspective (e.g. Peterson et al 2012). However attribution studies in South America are under-represented in the literature compared to other regions, and fires as an extreme event type have limited documentation in the attribution literature.
Fire occurrence can be strongly influenced by droughts, which in turn have been shown to be significantly controlled by variations in sea surface temperature patterns (Aragão et al 2007, 2018, Marengo et al 2011, Coelho et al 2012, Jiménez-Muñoz et al 2016, Marengo and Espinoza 2016, Panisset et al 2018). For instance, the 2005 drought was reported as a consequence of the North Tropical Atlantic Ocean warming (e.g. Aragão et al 2007), the 2010 drought was linked with both the North Tropical Atlantic Ocean warming and El Niño Southern Oscillation (ENSO, e.g. Marengo et al 2011), and the 2015/16 drought was associated with ENSO (e.g. Jiménez-Muñoz et al 2016). Hence we focus this study on the fire season during 2015, because 2015 saw the strongest El Niño event in the historical record (measured by the Oceanic Niño Index-ONI, https://origin.cpc.ncep.noaa.gov/products/analysis_monitoring/ensostuff/ONI_v5.php), resulting in extreme drought conditions in the Amazon and North East Brazil (Jiménez-Muñoz et al 2016, Ribeiro et al 2018). Since all of the attribution results presented in this study will be conditioned upon the strong El Niño state in 2015, we also investigate the impacts of ENSO on fire weather to assess the relative effects of El Niño to human-induced climate change on the likely occurrence of such an event. Investigating the impacts of ENSO states on fire weather is of great importance to understand the role ENSO plays in promoting strong fire weather conditions, which could be used to develop local and regional forecasting and projection capacities for fires in Brazil.
The main aim of this study is to establish the relationship between fire weather and burned area (BA), and to investigate the contributions of anthropogenic climate change to the fire weather conditions as or more intense than observed for the 2015 fire in Brazil. This study not only contributes to the extreme event attribution (EEA) literature in South America, but also applies the attribution method to assess changes in weather and climate conditions that promote fires (referred to as fire weather throughout this study), a less well-documented extreme event type in the attribution literature. Performing such an attribution study provides an essential step towards understanding fire danger. In this study, when referring to fire danger, we specifically refer to factors due to weather and climate.
2. Data and methods
2.1. Burned area (BA)
BA data was obtained from the European Space Agency (ESA) Fire Climate Change Initiative (CCI), the MODIS derived Fire_cci burned area pixel product version 5.1 (FireCCI51, Chuvieco et al 2018), which is a long-term gridded product of BA information from satellites, as part of the ESA CCI. By providing a consistent BA time series, the data was widely used in studies of historical burned patterns, fire management, emissions analysis and climate change (e.g. Nogueira et al 2017, Lizundia-Loiola et al 2020). At the time of the analysis the available time period for analysis from ESA FireCCI51 was 2001–2018. To verify the BA results from ESA, we also looked at the BA data from the global fire emissions database (GFED4, Giglio et al 2013) from 2001 to 2015. GFED4 showed similar anomalous results, as ESA FireCCI51 BA anomalies (shown in figure 1), for the BA in 2015 (w.r.t. 2001–2015) over the Cerrado and the Arc of deforestation (results not shown here), hence the anomalous BA was robust across different products. Only ESA results were presented here because it has a longer record, hence more data to establish the relationship between BA and fire weather.

Figure 1. The total BA in 2015/16 in km2 from the ESA FireCCI51. The green area denotes the Cerrado region, and the light blue shaded area denotes the Arc of deforestation region as defined in this study.
Download figure:
Standard image High-resolution image2.2. Fire weather index (FWI)
To describe fire weather conditions, the Canadian Forest Service Fire Weather Index Rating System (FWI) was used. FWI was originally developed for the Canadian forests as a numerical indicator of potential fire intensity, but it had been shown to be an effective indicator of fire activities across other climatic regions and vegetation species of the world (e.g. Abatzoglou et al 2018, 2019, Krikken et al 2021). FWI combines the effects of fuel aridity with fire spread rates. The former is influenced by climate on longer timescales by influencing fuel compositions and structures, as well as promoting or hindering the growth of fuels; whereas climate variability prior to and during a particular fire season controls how dry the fuel is. The latter is influenced by short term fluctuations in relative humidity, wind speed and temperature (Ruffault et al 2017, Abatzoglou et al 2018). In essence, FWI contains weather-climate information on timescales spanning from daily to interannual. Di Giuseppe et al (2016) compared FWI with two other measures of fire danger, namely the US Forest Service National Fire-Danger Rating System and the Australian McArthur Forest Fire Danger Meter (Mark 5) fire danger index (FDI). They showed all indexes had higher skill than random forecasts in detecting fire and that for South America, where drought conditions were the main cause of escaped fire danger (from managed pastures to intact forests), fires were well predicted by all three indices. In this study, we focused on the FWI.
FWI has five sub-indices representing different aspects of fire danger: the build-up index (BUI), the initial spread index (ISI), the Duff moisture code (DMC), the fine fuel moisture code (FFMC), and the drought code (DC). As explained by van Wagner (1987), BUI represents 'the total fuel available to the spreading fire', ISI 'rate of spread alone without the influence of variable quantities of fuel', DMC 'loosely compacted decomposing organic matter', FFMC 'litter and other cured fine fuels', and DC ' a deep layer of compact organic matter'. In essence, FFMC, DMC and DC describe the moisture available in the fuels at different depths, with higher values representing heightened drought conditions; and FWI provides a summary of fire potential (Kirchmeier et al 2017), with higher values denoting higher fire potential, i.e. increased fire danger. To make our results more relevant and relatable to the actual BA, FWI was investigated as a possible proxy for the BA (discussed in section 3.2).
FWI is calculated using daily 24 h accumulated precipitation, as well as local noon time temperature, humidity and wind speed. However, for the models used in this study (as detailed below), due to output restraints, daily average of wind speed (WIND), humidity (RH), daily maximum temperature (TMAX) and daily cumulative precipitation (Pr) were used, same as done in previous studies (Jolly et al 2015, Abatzoglou et al 2018, 2019, Krikken et al 2021). Krikken et al (2021) showed that these two methods of calculating FWI do not show significant differences in the attribution results of the probability ratios (PRs), although the actual values of FWI differ.
The 1987–2019 daily FWI, BUI, ISI, FFMC, DMC, and DC were extracted from the fire danger indices historical data from the Fifth generation of European Centre for Medium-Range Weather Forecasts atmospheric reanalysis of the global climate (ERA5) (Giuseppe et al 2019). ERA5 is the current state-of-the-art reanalysis product, with high spatial (approx. 30 km, 137 vertical levels) resolution.
2.3. Regions of interest
The geographical focus was primarily the Cerrado region, which was severely affected as measured in BAs; we also looked at eastern Pará and northern Mato Grosso known as the 'Arc of deforestation', as a secondary geographical focus.
Cerrado is the second largest biome in Brazil, originally covering ∼2 million km2 (Ratter et al 1997). There are a myriad of vegetation species in the region graduating from grasslands through savannah woodlands to forests, all harboring high levels of species endemism and biodiversity. These unique ecosystems play a critical role in storing carbon and maintaining the watersheds. Fires are an important part of maintaining this diversity, where too much or too little fire causes adverse effects on the ecosystem (Durigan and Ratter 2016). Unlike the humid Amazonia biome, where fires are almost exclusively anthropogenic (although rare, it is possible for naturally occurring wildfires to happen through ignition by lightning.), in the Cerrado fires can occur naturally (e.g. Ramos-Neto and Pivello 2000), therefore it is a fire-adapted biome (Pivello 2011). However, the increased drying effect of climate change could result in an increased exposure to severe fire weather for Cerrado, which could disturb the fire-adapted biome. The challenging task of developing appropriate fire and ecosystem management policies for the Cerrado needs to account for the change in likelihood of strong fire weather conditions due to anthropogenic climate change.
We also investigated the eastern Pará and northern Mato Grosso, because these parts correspond to the transition region from the Cerrado to the Amazonia- a fire-sensitive biome (Pivello 2011). These regions have suffered intense deforestation for more than two decades (thus dubbed as the 'Arc of deforestation'.) as well as deforestation-associated wildfires that have resulted in widespread forest degradation (Pivello 2011). In recent years the synergy of human activities that alter forest structure and droughts has been suggested as the underlying cause of wildfires in these regions (Aragão et al 2007, 2008, Bush et al 2008, Cochrane and Laurance 2008, Pivello 2011). Wildfire is currently one of the important drivers of carbon loss over the Amazon region (Aragao et al 2018, Silva Junior et al 2019, Silva et al 2020). Wildfire in this region also has further implications because the net carbon exchange between tropical land and the atmosphere may constitute a feedback on the global climate (Aragão et al 2018).
The Cerrado biome boundary was taken from the Brazilian Ministry of Environment and the Brazilian Institute of Geography and Statistics (www.ibge.gov.br/geociencias/downloads-geociencias.html). The Arc of deforestation domain is roughly taken as previously defined by multiple sources (e.g. Aldrich et al 2012, Diniz et al 2013, Rajão and Vurdubakis 2013). Analyzing the results through the lens of these two regions could provide more insights on which region is more vulnerable to anthropogenic climate change induced wildfires, as well as an understanding of the main contributing climatic factors.
2.4. Statistical methods
To investigate the anthropogenic climate change impacts on fire weather factors, we adopted the risk-based approach to EEA as detailed in Otto (2017), an approach used in many previous EEA studies (e.g. Sippel et al 2016, Hauser et al 2017, Oldenborgh et al 2017, Schiermeier 2018, Vautard et al 2019). In this approach two sets of simulations representing the current climate condition as observed (hereafter Actual) and the pre-industrial climate condition without human influences (hereafter Natural) are performed, and the ratio of the likelihood of occurrence of a defined extreme event between the two is established, referred to as PR from here on.
As a common practice in attribution studies (Otto 2017), the rarity of the event is characterized by return period time defined from the observational-based dataset. In this study, the return period time of the 2015 event as defined from ERA5 was determined (RTobs). Instead of bias-adjusting the magnitude of model simulated FWI, for each model we selected the FWI value that corresponded to RTobs in the Actual simulations, after which this model specific FWI threshold value was used to estimate the return period times and PRs in each model, same as done in previous studies (e.g. van Oldenborgh et al 2017, 2021). In each model the PR was calculated as Pact/Pnat, i.e. the probability of exceeding the FWI threshold under Actual climate conditions-Pact, divided by the probability of exceeding the FWI threshold under Natural climate conditions-Pnat. PR higher than 1 denotes an increased likelihood of occurrence with anthropogenic climate change. All the uncertainty estimates presented in the results were calculated using bootstrap (Efron and Tibshirani 1994, 1000 replications).
In this study, not only did we investigate the PR for the 2015-like events, i.e. events of the same return period time as the one in 2015, but also the PRs for events across a wider spectrum up to events of once-in-a-100 years.
2.5. Model simulations
To account for systematic errors in individual climate models, preferably more than one model is used to undertake the two sets of simulations. In this study we use two different models.
2.5.1. Weather@home simulations
The first set of attribution simulations were generated through the volunteer computing platform weather@home (Massey et al 2015, Guillod et al 2017). Weather@home uses the UK Met Office's HadAM3P atmospheric circulation model (Gordon et al 2000, Pope et al 2000, Massey et al 2015) with 1.875° × 1.25° horizontal resolution, and 19 vertical levels, together with the Met Office Surface Exchange Scheme 2 (Essery et al 2003), to drive the Met Office Hadley Centre regional model (HadRM3P, or PRECIS model) at 50 km over South America.
To simulate the atmospheric and land surface conditions during 2015, two large ensembles representing the climate as observed in 2015 (Actual) and what would have been the climate of 2015 without human influences (Natural) were performed, with the same methodology for experiment setups as done for previous studies (e.g. Schaller et al 2016, Sparrow et al 2018). For the fire weather attribution analysis, ∼500 Actual simulations and ∼1950 Natural simulations are used. Interested readers are referred to the supplementary information (available online at stacks.iop.org/ERL/16/094051/mmedia) for the detailed experiment setup and the number of simulations retained. Historical simulations (hereafter Historical) were run with observed sea surface boundary conditions for the period 1987–2016, providing a baseline climatology to evaluate the model's performance.
2.5.2. HadGEM-A simulations
The second set of attribution simulations were from the HadGEM3-GA6 model, the atmospheric component of the Met Office's Global Environment Model version 6 (HadGEM3-A hereafter; Walters et al 2017). This model has a horizontal resolution of 0.55° × 0.9°(N216; ∼60 km at mid-latitudes), and the system has been used for various event attribution studies (e.g. Ciavarella et al 2018, Sparrow et al 2018, Vautard et al 2019, Leach et al 2020, Undorf et al 2020).
A 15 member ensemble from 1960 to 2013 (Historical) was run using observed sea surface boundary conditions, providing a baseline climatology for the model. These 15 members were separated by a perturbed physics scheme. For more details, interested readers are referred to Ciavarella et al (2018). For 2014–2015, two sets of attribution simulations (105 ensemble members for each) were run, one set of Actual simulations, and one set of Natural simulations. The 15 Actual simulations corresponding to the same purebred physics schemes used for the Historical were selected and appended to extend the Historical to 2015.
2.6. Metrics of interest
To make our results more relevant and relatable to the actual BA, we assessed whether FWI was an effective indicator of the BA in our regions of interest across different temporal definitions. The metrics considered were: monthly mean (monmean), monthly maximum (monmax) of daily FWI, and the monthly maximum of 7 d running mean (monmax7d) of daily FWI. As in previous studies (Keeley and Syphard 2017, Williams et al 2019, Goss et al 2020) we used logarithms of BA to accommodate the exponential distribution of BA across space.
2.7. ENSO impacts
As mentioned previously, 2015 saw the strongest El Niño in the historical record, with ONI reaching 2.4 in September–October–November. Since all of the attribution results would be conditioned upon the El Niño state in 2015, we also investigated the impacts of ENSO, focusing on the relative effects of El Niño to human-induced climate change on the likely occurrence of strong fire weather conditions. FWI from all the strong El Niño years (with ONI > 1.0), the strong La Niña years (with ONI < −1.0), neutral years (−0.5 < ONI < 0.5), were selected to compare against each other. The strong El Niño years were: 1987, 1997, 2002, 2009, and 2015; the strong La Niña years were: 1988, 1995, 1998, 1999, 2007, 2010, and 2011; and the neutral years were: 1989, 1990, 1992, 1993, 1996, 2001, 2003, 2005, 2008, 2012, 2013, and 2014. Only the HadRM3P simulations from weather@home were used because of the larger number of simulations available, yielding better statistical characterization of the results. Analysis was limited to the available model climatology time period (1987–2016).
3. Results and discussions
3.1. Burned area (BA) and fire weather index (FWI)
Figure 1 shows that fire in 2015 most severely affected the Cerrado (highlighted as the green contour) through August to October, with peak activity (measured by BA) and anomalous high BA (compared with 2001–2015 baseline period, figure S1) during September and especially October, although there were also anomalous BA in June and July. The Arc of deforestation region (blue shading) also experienced anomalous high BA, peaking in September and October, but not as severe as the Cerrado. By November, the fire died off with the beginning of the rainy season. Figure 1 shows an area of very high activity in the northern Cerrado, which is an area dominated by grassy vegetation species which are naturally flammable and under drought conditions become much more flammable. Lighting activity is usually higher in September–October (Ramos-Neto and Pivello 2000) and in drought conditions it was not followed by rainfall, thus resulting in higher fire activity. In the Arc of deforestation however, vegetation is less flammable than in the grasslands and woodlands of the Cerrado, and fires depend on anthropogenic ignition sources to light the fires (Barlow et al 2020).
As shown in figure 2, FWI does serve as a reasonable proxy for BA in the Cerrado in October for all three metrics considered here (R2 ∼ 0.84). Although BA is larger in September (figure 1), the relationship between FWI and BA (R2 ∼ 0.74) is not as high as in October, and even much lower in August (R2∼ 0.45). For the Arc region, the correspondence between FWI and BA is weaker than in the Cerrado, although the relationship is strongest in October on average (of the three metrics) in a similar manner to the Cerrado. One potential explanation for the stronger association between FWI and BA in the Cerrado is that under drought conditions, the extremely dry grassy vegetations in the Cerrado are subject to very little influence of the local microclimate, all are very dry and flammable. In the forest vegetation of the Arc region, the role of the local microclimate might still control the total BA (i.e. a fire stops when finding a patch of forest with a more moist microclimate). Another explanation is the issue of detection bias where cool-burning understory fires in closed canopy forests are less likely to be detected than hot-burning fires in open-canopy ecosystems. Given that (a) October FWI has the highest R2 with BA, and (b) 2015 October experienced a much higher anomalous BA (figure S1), we focus on October in this case study. We also consider August–September–October (ASO) mean FWI, and 90th percentile (p90) of the daily FWI in ASO (shown in figure S3), but the relationships are not as strong as the metrics presented here. FDI is also investigated as a proxy for BA (results now shown here), however FWI shows a stronger correlation with BA than FDI across all months, so we only focus on FWI in this study.

Figure 2. Scatter plot of the FWI vs log scaled BA over the Cerrado (the top row) and the Arc of deforestation (the bottom row) in August, September, October (when fire was more severe as shown in figure 1), over 2001–2018. The linear fit between FWI and BA are shown as solid lines, with R2 shown in the legend box. The metrics considered are: monthly mean of daily FWI (in panels (a) and (d)), monthly maximum of daily FWI (in panels (b) and (e)), and monthly maximum of 7 d running mean of daily FWI (in panels (c) and (f)). BA data is from ESA FireCCI51, and FWI data is from ERA5.
Download figure:
Standard image High-resolution imageHence, in the rest of the analysis, we investigate the change in FWI (and the factors contributing to FWI) between the Actual and Natural simulations over each region for October, which will provide some insights for the anthropogenic climate change impacts on BA, given the strong association between FWI and BA. Combining fire spread with fuel availability, the FWI index reflects the impacts of wind, humidity, temperature and precipitation, therefore it is expected that the FWI attribution result would be more relevant to the fire danger itself compared with just attributing these individual climatic factors.
3.2. Fire weather attribution
As mentioned in the section 2, the rarity of the event is characterized by return period time defined from the observational-based dataset. We also consider whether different temporal definitions of FWI would affect the rarity of the 2015 event. Figure 3 shows the results for Cerrado in October (parallel results for the Arc are shown in figure S5), and all three indicated a similar return period for 2015, on the order of a decade return time of 13.67 (5.86–41.0, 5%–95%) years for monmean; 10.25 (5.13–20.5) years for monmax; 13.67 (5.86–41.0) years for monmax7d. In short, an event like the one in 2015 happens approximately once per decade.

Figure 3. ERA5 overview of how extreme the 2015 event was in Cerrado. The associated return period is 13.67, 10.25, and 13.67 years for monthly mean (monmean) of daily FWI, monthly maximum (monmax) of daily FWI, and monthly maximum of 7 d running mean (monmax7d) of daily FWI in October, respectively. The FWI over the historical period from HadRM3P and HadGEM-A are also shown. Panels (a) through (c) show the raw values of FWI, and panels (d) through (e) show the anomaly of FWI with respect to the event threshold in each dataset (the FWI that corresponds to the 2015 event return time as defined in observation). The vertical red line indicates the return time of the 2015 event for each metric.
Download figure:
Standard image High-resolution imageFWI over the historical period from HadRM3P, and HadGEM-A are shown in figure 4 for all three metrics. The FWI representation in HadRM3P is closer to that from ERA5. The effectiveness of centering the results on the model specific FWI threshold values (as described in section 2.6) is illustrated in figures 3(d)–(f). The magnitudes of anomalies are more in line with the observed for both models. The trajectories of the HadRM3P and HadGEM-A curves closely follow the observed for all three metrics. While this approach has the advantage of bypassing the issue of model biases in FWI magnitude, given that HadRM3P better represents the magnitude of FWI over the historical period (as shown in figures 3(a)–(c)), we focus on the attribution results from the HadRM3P model in the following discussions.
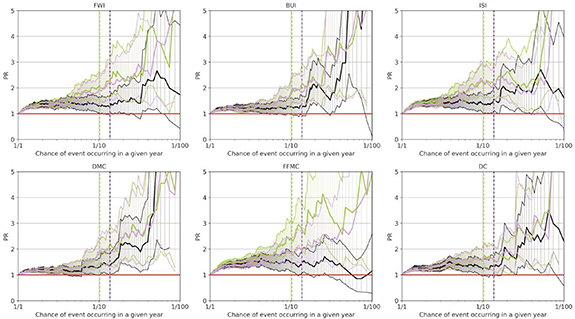
Figure 4. PRs for FWI and the sub-indices for the Cerrado. PR of 1 is highlighted as the horizontal red solid line in each panel, denoting no change. The monmean, monmax, and monmax7d of FWI in October are shown in black, green, and purple respectively. The return time of the 2015 event for each metric is highlighted as the vertical dashed black, green, and purple lines respectively. The shading indicates the 5%–95% uncertainty range calculated from bootstrapping. Monthly mean is used for monmean, monmax is the 1 d maximum, and monmax7d is the maximum of 7 d running mean in a month.
Download figure:
Standard image High-resolution imageFirst we examine the effect of anthropogenic emissions on FWI and its sub-components. Figure 4 shows PR of FWI, BUI, ISI, DMC, FFMC, and DC for the Actual relative to the Natural climate conditions (parallel results for the Arc are shown in figure S6). For the 2015-like event, monmean FWI shows a small increased PR of 1.25 (0.95–1.64), which is not statistically significant. All the other indices show a similar magnitude of increased PRs (as summarized in figure 6); of these ISI and FFMC show statistically significant increases, i.e. the lower bound of PR is greater than 1. All the indices show similar PR behaviors across the different return times, except for FFMC monmean, which shows decreased PR for return times longer than 50 years. FWI on the timescales of monmax and monmax7d both show statistically significant increase of PR in response to anthropogenic climate change, and both present a much larger increase in PR across the different return times compared with monmean. The increase in PR for FWI is of a similar order of magnitude as the increase in PR for ISI and FFMC over the Cerrado. Since FFMC is representative of the moisture content in the top layer and can change rapidly due to the influence of instantaneous weather conditions, it plays an important role in FWI on short timescales. ISI is an indicator of fire spread rate, combining FFMC and wind speed, thus also important on short timescales. Figures 6(d)–(f) summarizes PR for the different FWI components for the Arc of deforestation region. The magnitudes of the PRs are similar to the Cerrado with BUI and DMC showing weaker responses than the other components. Looking across all the return times (figure S6), in comparison to the Cerrado, the Arc region shows a less dramatic increase in PR at longer return periods across all of the FWI subcomponents and different timescales.

Figure 5. PRs for maximum temperature (TMAX), relative humidity (RH), precipitation (Pr) and wind (WIND) used to calculate FWI for the Cerrado. PR of 1 ishighlighted as the horizontal red solid line in each panel. The monmean, monmax, and monmax7d are shown in black, green, and purple respectively. The return time of the 2015 event for each metric is highlighted in vertical dashed black, green, and purple lines respectively. The shading indicates the 5%–95% uncertainty range calculated from bootstrapping.
Download figure:
Standard image High-resolution image
Figure 6. PRs of the different variables for the 2015-like event over the Cerrado for monmean in (a) and (d), monmax in (b) and (e), and monmax7d in (c) and (f). The top row shows the results for the Cerrao and the bottom row shows the results for the Arc of deforestation. The horizontal dotted lines separate the FWI-related indices from the climate variables used to calculate FWI. Each horizontal red box denotes the PR (the vertical black line) and the 5%–95% uncertainty range calculated from bootstrapping (the range of the box).
Download figure:
Standard image High-resolution imageFurther examination of the climate variables used to calculate FWI (shown in figure 5, Arc results shown in figure S7) indicates that, for the 2015-like event (monmean), there is a significant increase in temperature under the Actual climate conditions compared with the Natural, with a 6.31 (4.27–9.49) fold increase in probability of occurrence. Furthermore, there is a significant decrease in relative humidity with a PR of 0.48 (0.36–0.63). Hence in the Actual world with anthropogenic climate change, the near surface air is significantly drier compared with the Natural world without anthropogenic climate change. The significant increase in temperature and significant decrease in humidity due to anthropogenic climate change is consistent across the different return times. For precipitation and wind speed, for the 2015-like event, the difference between Actual and Natural climate conditions are small and not significant (0.90 [0.66–1.17] and 0.94 [0.67–1.23]). However, for more frequent events (shorter return times) precipitation shows a decrease (up to return time of ∼5 year) and wind speed shows an increase (up to return time of ∼4 year) that are statistically significant. Results presented in figure 5 (and summarized in figure 6) suggest that the differences between Actual and Natural temperature and humidity are more dominant, and thus are the main drivers behind the FWI's response to anthropogenic climate change for both the Cerrado and the Arc region (figure S7). Our results here corroborate previous findings by Silva Junior et al (2019) that positive temperature anomalies contribute significantly to the positive fire anomalies during late 2015, and the findings by Lima et al (2018) that temperature could be an important driver of fire incidences in Amazonia. Silva Junior et al (2019) also suggests that the interaction between negative rainfall and positive temperature anomalies leads to the large positive fire anomaly in late 2015. However, we find no attributable change in precipitation in response to human-induced climate change. In figures 5 and 6, we also show the results for monmax and monmax7d. Although RH, Pr and WIND show broadly similar results as the monmean, the PR increase in TMAX is much higher than monmean results, especially on the timescale of monmax. This suggests that TMAX on shorter timescales shows a stronger response to anthropogenic climate change over the Cerrado; whereas for the Arc region, this is not always the case: for the 2015-like event, the PR increase of the monmean is higher than monmax and monmax7d. The PR reduction in Pr in the Arc region is more pronounced in monmean and monmax than for the Cerrado and the PR increase in WIND is a lot higher than in the Cerrado. This is in line with previous evidence that fires could induce fragmentation in the Amazon forests and extreme wind disturbances (Schwartz et al 2017, Silvério et al 2019), although the synergistic effects of fire, fragmentation and windstorms on a tropical forest are much more complex (Silvério et al 2019) than discussed in this study.
In general, FWI in the Actual simulations is higher than in the Natural simulations in both the Cerrado and Arc region, i.e. the fire weather condition is stronger, showing that anthropogenic climate change has contributed to increased fire danger for a 2015-like event. For monmax and monmax7d these changes are statistically significant in both study regions. Both TMAX and RH show a strong response to anthropogenic climate change.
3.3. ENSO impacts on fire weather
Comparing FWI under different ENSO states (figure 7) showes that during strong El Niño years, FWI values are in general higher than strong La Niña years and ENSO neutral years. FWI values during strong La Niña years are similar to those during ENSO neutral years, with no statistically significant differences across different return times. The PREl/neutral for the 2015-like event, comparing the probability of occurrence under strong El Niño conditions-PEl, with the probability of occurrence under ENSO neutral conditions-Pneutral is 2.1 (0.69–4.8), which is slightly higher than the Actual/Natural Pact/Pnat of 1.25 (0.95–1.64), although the 5%–95% confidence interval is wider for PREl/neutral. PEl over the probability of occurrence under strong La Niña conditions-PLa (PREl/La) is 2.8 (0.47–9.8), which is even higher than PREl/neutral, with an even larger uncertainty range. PRLa/neutral is 0.59 (0.28–1.04). These results suggest that high FWI (indicating heightened fire danger) is more likely to occur under El Niño conditions, and less likely under La Niña conditions. However, from figure 6 it is evident that the impacts of El Niño and La Niña conditions are not symmetric when compared with the ENSO neutral state.

Figure 7. The comparison between FWI from all the strong El Niño years, the strong La Niña years, and the ENSO neutral years. The return time of the 2015 event for monmean is highlighted as the solid red line. The PR for the 2015-like event, comparing the probability of occurrence under strong El Niño conditions-PEl over the probability of occurrence under ENSO neutral conditions-Pneutral, and comparing PEl over the probability of occurrence under strong La Niña conditions-PLa, as well as PLa over Pneutral are shown in the upper left corner.
Download figure:
Standard image High-resolution image
4. Conclusions and further discussions
The role of anthropogenic climate change in regional wildfire danger over the Cerrado and Arc of deforestation is assessed using the 2015 wildfire as a case study. FWI is shown to be a reasonable proxy for the extent of BA in these regions during October and the climatic factors contributing to fire weather (indicated by FWI) are investigated. Anthropogenic climate change impacts are investigated by assessing whether and to what extent the likelihood of a high FWI has increased in climate model simulations of the current climate conditions, compared with simulations of a climate without anthropogenic greenhouse gases.
Our results show that (a) anthropogenic climate change is indeed a driver of the high fire weather conditions (as indicated by high FWI) for the 2015-like event in these two regions, especially on shorter timescales of daily and weekly; (b) the increase in PR for FWI on shorter timescales corresponds to a similar order of increase in ISI and FFMC, which can rapidly change due to the influence of instantaneous weather conditions, hence are functional on short timescales; (c) the change in FWI in response to anthropogenic climate change is mostly driven by changes in temperature and relative humidity over the Cerrado and the Arc; and (d) high FWI is more likely to occur under El Niño conditions and less likely under La Niña conditions, although the PR is not statistically significant for the 2015 case study. Our results also show that the impacts of El Niño vs La Niña conditions are not symmetric when compared with ENSO neutral states. To summarize, both human-induced climate change and the presence of El Niño increased the likelihood of occurrence for the strong fire weather condition in 2015.
Our results suggest differences in extreme events on shorter timescales are dominated by responses in FFMC (that controls top layer moisture content) and ISI (that indicates the rate of fire spread influenced by instantaneous winds). The relative contribution of different FWI components, depending upon the timescale of interest, could provide useful guidance on early warning and firefighting preparations to minimize disastrous effects of wildfires. On all timescales investigated here (monmean, monmax and monmax7d), the response of FWI to anthropogenic climate change is dominated by temperature and relative humidity changes. Although FWI only provides a numeric indication of fire danger, actual fire activities will ultimately depend on the susceptibility of the local landscape (influenced by land use and land change), and human activities through fire ignition or suppression and management. The strong control of drought conditions on FWI provides insights into the on-the-ground adaptation measures, such as implementing improved drought monitoring and warning systems, more effective fire prevention actions and firefighting planning, in order to minimize the land degradation, carbon emissions, economic damages and adverse impact on human health from fires.
Acknowledgments
This work was supported jointly by the Nature Conservancy-Oxford Martin School Climate Partnership, and the Newton Fund through the Met Office Climate Science for Service Partnership Brazil (CSSP Brazil). Contribution from S L, S R, S S and Y M was supported through CSSP Brazil and S L, S R, F O, Y M and D W were supported by the Nature Conservancy-Oxford Martin School Climate Partnership. We would also like to thank the Met Office Hadley Centre PRECIS team for their technical and scientific support for the development and application of weather@Home. Finally, we would like to thank all of the volunteers who have donated their computing time to climateprediction.net and weather@home.
Data Availability Statement
All data used in this study is derived from the European Centre for Medium-Range Weather Forecasts' ERA5 product which is openly available from the Copernicus Climate Change Service (C3S) at https://cds.climate.copernicus.eu/. The model simulations used in this study will be deposited in the Centre for Environmental Data Analysis (CEDA) and are available on request from the corresponding author prior to this.
The data that support the findings of this study are available upon reasonable request from the authors.