The .NET Meteor extension allows you to build, debug and deploy .NET apps to devices or emulators.
-
Cross-Platform
You can use this extension in theWindows,MacOS, andLinuxoperation systems. -
No additional dependencies
The extension doesn't require any additional extensions to work. You can use it out of the box. -
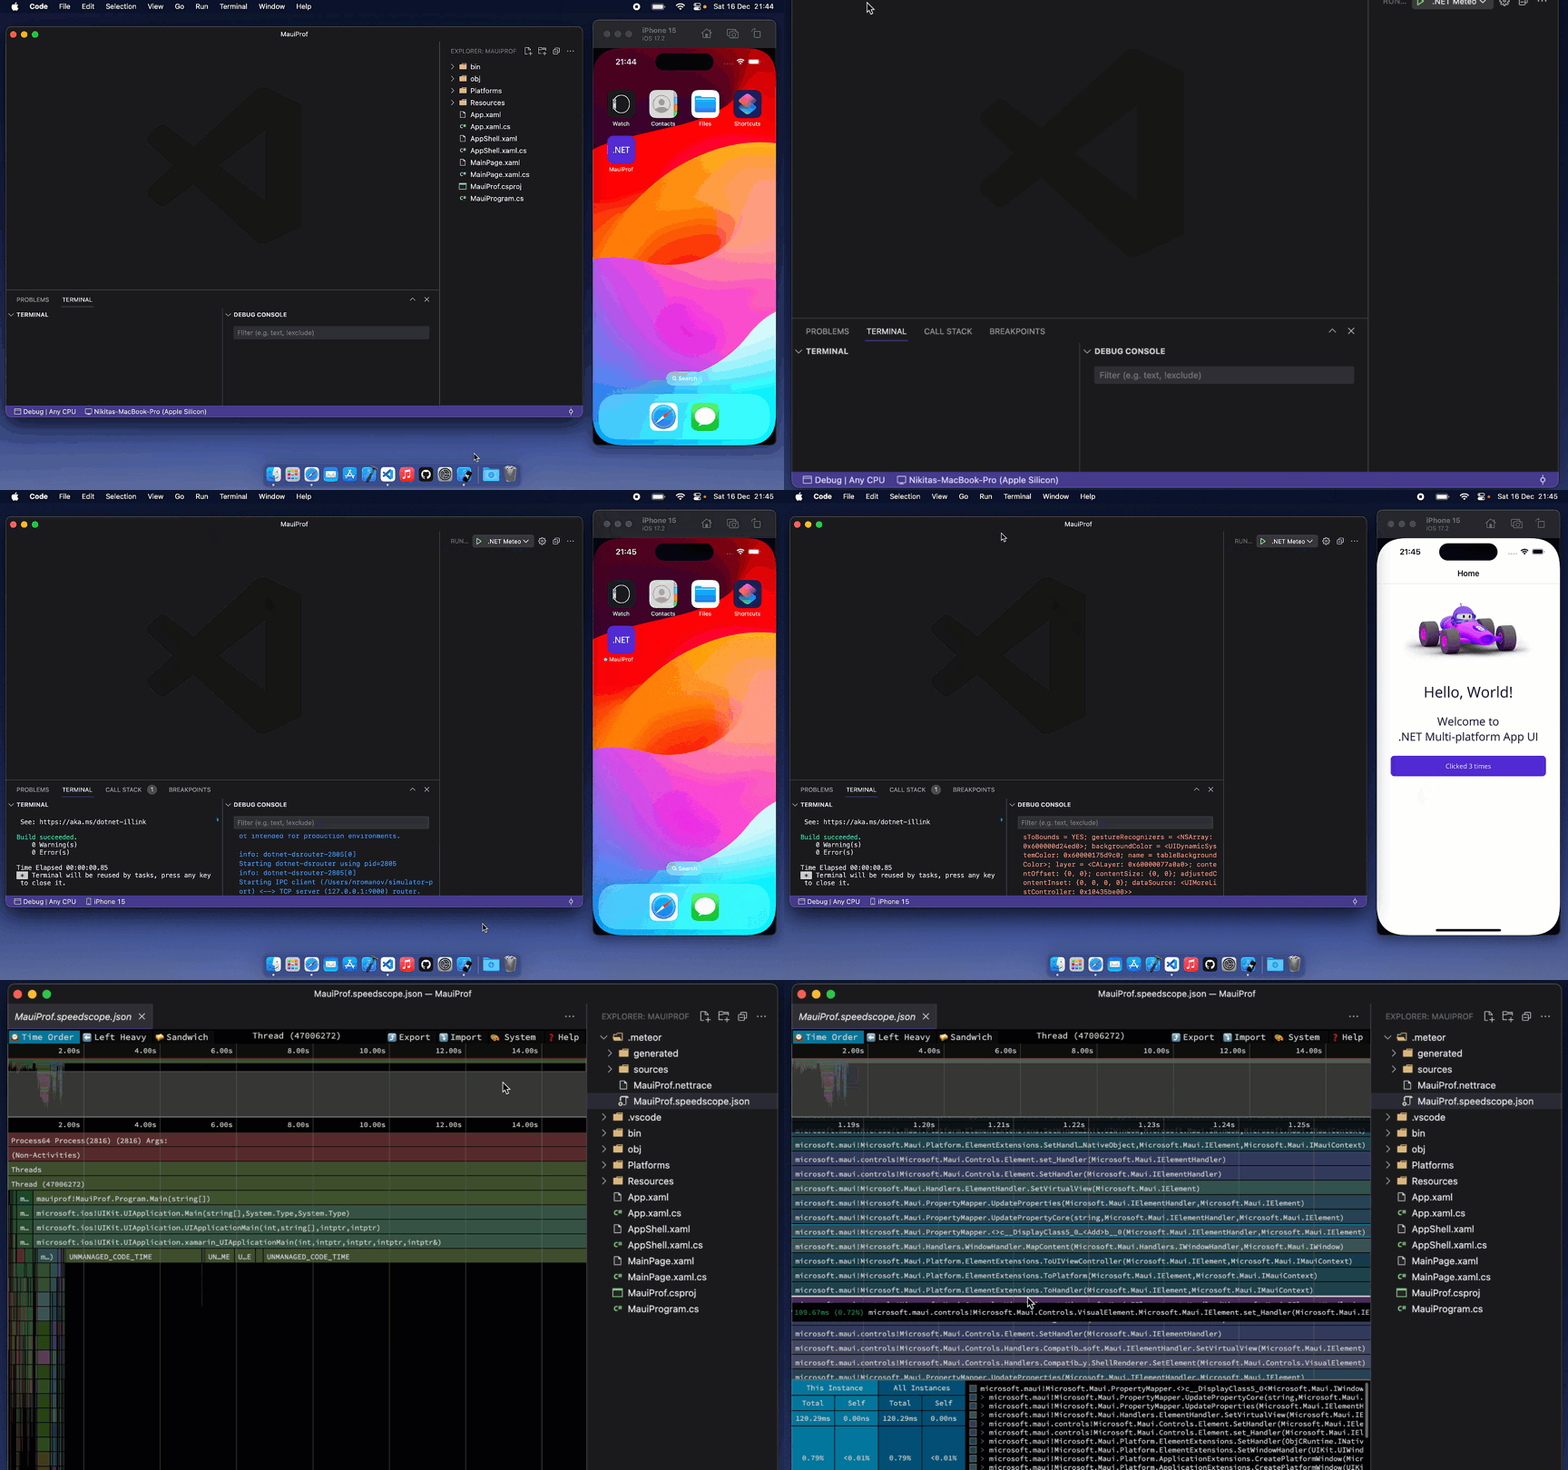
Performance and Memory Profiling
You can profile your application to find performance bottlenecks and undisposed objects that persist in the memory. See the instruction below to enable profiling in your project. -
Debug iOS Devices on Windows with Pair to Mac
Build your project on a remote Mac and deploy it to an iOS device connected to your Windows machine using the Pair to Mac feature. Check these instructions for more details. Please note that only physical devices (not simulators) are currently supported. -
Enhanced MAUI support
The extension provides you with aXAML intellisenseandXAML Hot Reloadfor any platform. See the instruction below to enable Hot Reload in your project. -
Multi-root Workspaces support
You can use muliple folders in your workspace and change the current running project. -
F# support
Your can build and debug projects, written in theF#language.
- Open the project folder.
- Open the
Run and DebugVSCode tab and click thecreate a launch.json file. - In the opened panel, select the
.NET Meteor Debugger. - In the status bar, select a project (if your opened folder contains several projects) and a configuration (the debug is the default).
- In the status bar, click the device name and select a target device/emulator from the opened panel.
- Press
F5to debug the application orctrl + F5to launch the application without debugging. - Enjoy!
- Open the
.csprojfile of your project and add the following package reference:
<ItemGroup>
	<PackageReference Include="DotNetMeteor.HotReload.Plugin" Version="3.*"/>
</ItemGroup>- Enable Hot Reload Server in your
MauiProgram.cs:
using DotNet.Meteor.HotReload.Plugin;

public static class MauiProgram
{
    public static MauiApp CreateMauiApp()
    {
        var builder = MauiApp.CreateBuilder();
        builder
            .UseMauiApp<App>()
#if DEBUG
            .EnableHotReload()
#endif
        ...
        return builder.Build();
    }
}- Now you can run your project, update XAML and see updates in real-time!
- Open the project folder.
- Open the
Run and DebugVSCode tab and click thecreate a launch.json file. - In the opened panel, select the
.NET Meteor Debugger. - Specify a profiler mode option (
traceorgcdump) in the generated configuration. For example:
{
	"name": ".NET Meteor Profiler",
	"type": "dotnet-meteor.debugger",
	"request": "launch",
	"profilerMode": "trace",
	"preLaunchTask": "dotnet-meteor: Build"
}- In the status bar, select a project (if your opened folder contains several projects) and a configuration (the debug is the default). Click the device name and select a target device/emulator from the opened panel.
- Press
ctrl + F5to launch the application without debugging.
- If you use the
gcdumpmode, type a/dumpcommand in theDebug Consoleto capture the report. You will see the message:
Writing gcdump to '/Users/You/.../Project/MauiProf.gcdump'...
command handled by DotNet.Meteor.Debug.GCDumpLaunchAgent
Finished writing 2759872 bytes.
- If you use the
tracemode, clickStop Debuggingin the VSCode to stop the profiling. Don't close the application manually, because this may damage the report. After completion, you will see the message:
Trace completed.
Writing:	/Users/You/.../Project/MauiProf.speedscope.json
Conversion complete
- You can see the
speedscope.jsonreport in the root folder of your project. You can use the Speedscope in VSCode extension to view it. Alternatively, you can upload it directly to the speedscope site. For thegcdumpreport, you can use the dotnet-heapview or Visual Studio for Windows.
The profiler can capture and analyze functions executed within the Mono runtime. To profile native code, you can leverage platform-specific tools, such as Android Studio and Xcode.
.NET Meteor creates log files in the ~/.vscode/extensions/dotnet-meteor-*/extension/bin folder. You can find the following logs:
Workspace/Logs- logs from the current workspace.Xaml/Logs- logs from the XAML IntelliSense server.HotReload/Logs- logs from the Hot Reload server.Debug/Logs- log from the debugger and profiler.
If checking the logs didn’t solve the issue, please open a new issue in this GitHub repository. Be sure to include a description of the problem along with the log files.
.NET Meteor uses the .NET Diagnostics tools to profile applications. If you encounter any issues, please check the following:
-
VSCode Debug Console tab should display a message about the successful connection. If you see the
Router stoppedmessage or something similar, the connection is not established. You can try to change the profiler port in the .NET Meteor settings. -
When profiling is started, the Debug Console tab should display the
Output File:message. If you don't see this message after running the app and displaying the first view (after the splash screen), try deleting thebinandobjfolders and rerunning the project. Sometimes the issue occurs when you frequently switch between the profiling and debugging modes.


