Rehabilitation System Design
![]()
Introduction
Global trends in health and ageing signal the need for a major scaling up of rehabilitation services in countries around the world and in low- and middle-income countries in particular. Investment in rehabilitation allows people with a health condition to achieve and maintain optimal functioning, by improving their health and by increasing their participation in life. Strengthening rehabilitation in health systems is fundamental to responding to the increasing demand and ensuring that rehabilitation is available and affordable for those who require it. As recommended by the WHO Rehabilitation 2030 initiative, A Call for Action, a key action to strengthen rehabilitation is to collect data relevant to rehabilitation to enhance health information systems (HIS).
The data that are collected through routine rehabilitation health facility reporting, both from individual records and service records, are used to gather information for defining rehabilitation targets and outcomes, clinical decision-making, estimates of service utilization, and quality management. Regular monitoring of rehabilitation services at national and subnational level provides information about their availability and distribution which may inform measures that are taken to achieve Universal Health Coverage (UHC). System level rehabilitation data and information on functioning underpin rehabilitation decision-making in health policy, management and clinical care. Information on functioning is essential to decision-making in rehabilitation at all levels of the health system since the goal of rehabilitation is to optimize functioning in light of impairments, injuries, and acute or chronic diseases.
Purpose
The Rehabilitation Aggregate System Design document provides an overview of the design principles and guidance used to develop the digital data package for aggregate Rehabilitation surveillance. This document is intended for use by DHIS2 implementers at country and regional level to be able to support implementation and localization of the package. The Rehabilitation metadata package can be adapted to local needs and national guidelines. In particular, local work flows and national guidelines should be considered in the localization and adoption of the package.
Background
Rehabilitation service delivery covers a wide range of activities for various health conditions, and it is provided by a multidisciplinary workforce at all administrative levels of healthcare. Rehabilitation indicators for routine health facility reporting cover the common types of rehabilitation that are delivered and their relevant features for decision-making both at a system and health facility level. Fully aware of the potential burden of data collection in health facilities, this module uses a general approach in terms of service delivery and does not cover monitoring for specific rehabilitation interventions nor features related to specific intervention types.
What are the expected outcomes?
-
The indicators guide the data collected and support the integration of rehabilitation into facility level reporting.
-
The analysis framework supports health sector decision making for rehabilitation. It informs the analysis, monitoring and evaluation teams, and allows managers to look at the rehabilitation sector performance, including its integration into the health system, trends of health conditions and rehabilitation service utilization, patterns of quality features, and geographic differences for coverage of service delivery over time. The analysis framework should help program managers and health planners answer rehabilitation M&E questions such as: Are rehabilitation services equipped with adequate resources and where are the gaps? To what extent are rehabilitation services used and what are the features of utilization in relation to service capacity, user’s profile, and service delivery platform? How is rehabilitation contributing to UHC? How does rehabilitation effectiveness evolve in time? How well is rehabilitation integrated into the health system, and along the continuum of care? To what extent do people in need of longer stay, high-intensive, multi-disciplinary rehabilitation have access to quality care?
-
Program managers and planners could use the data for the establishment and follow up of real-time measures regarding accessibility, availability, human resources, quality, and service outcome.
-
The proposed standard indicators may be used for monitoring purposes of operational and strategic planning for rehabilitation. The data are then collected to track progress towards the objectives of a (national) strategic plan. While the ‘WHO Rehabilitation in Health System – Guide for Action’ document provides guidance for health system strengthening, it contains a section on the monitoring of a rehabilitation strategic plan, called FRAME2. A Rehabilitation Indicators Menu (RIM) with 40 indicators is included for this intent. Of 40 RIM indicators, 11 indicators are collected using data primarily provided by health facilities. As such, these 11 indicators form the basis of the facility indicators list for rehabilitation that are recommended for routine collection by facilities and collated through district health management information systems (DHMIS).
Intended users
The information provided through routine data collection and reporting from rehabilitation health facilities needs to be analyzed and used. This is typically done by the following target audience:
- Ministry of health decision makers such as rehabilitation program managers, data managers and health information system managers;
- Rehabilitation program partners and program planners;
- Health facility managers for rehabilitation;
- Research institutes involved with the assessment and improvement of rehabilitation data and information systems.
Module overview
The Rehabilitation aggregate package includes 6 proposed data sets for data collection and 7 dashboards.
Data sets
The data entry forms are logically divided by data collection periods and health care facility types.
Bed Density and Incidence Data

| Bed Density | giKizLegiUW |
|---|---|
| Data set form type | default |
| Data collection period | yearly |
| Facility types | Rehabilitation facilities with a dedicated rehabilitation inpatient ward |
Bed density dataset is a standalone dataset that includes 2 sections:
- Bed density
- Available rehabilitation beds (total)
- Incidence data
- Amputation
- Burns
- MMT
- SCI
- Stroke
- TBI
Note
- If the Rehabilitation bed density data is already collected in the existing DHIS2 HMIS system, it is possible to replace the proposed data element and its references with the existing element in the system. Please refer to the Rehabilitation package installation guide for information on additional configuration of bed density indicators.
- The list of health conditions can be adjusted according to national guidance.
Essential Package Availability at PHC

| Essential Package Availability | MGzqZDWvPhL |
|---|---|
| Data set form type | section |
| Data collection period | yearly |
| Facility types | Primary Healthcare Facilities reporting on Rehabilitation (Rehab PHC) |
Essential package availability dataset collects data on the availability of essential rehabilitation packages in primary healthcare facilities:
- WHO basic package
- Package selected from national guidance
Personnel Density

| Personnel Density | Sm2fALTZROS |
|---|---|
| Data set form type | section |
| Data collection period | yearly |
| Facility types | All facilities reporting on Rehab (Master Facility List) |
Rehabilitation occupational groups usually include rehabilitation doctors, rehabilitation nurses, physiotherapists, occupational therapists, speech language therapists, prosthetists and orthotists, and psychologists. Other rehabilitation occupational groups relevant to the country may also be included, for example audiologists, social workers and mid-level rehabilitation occupational groups. It is also possible to include hospital rehabilitation personnel that are not working for the rehabilitation department. A national health workforce plan typically includes a list of occupational groups for the country and it is recommended to consult this list when establishing the reporting system in the country.
This dataset collects numbers of the following rehabilitation groups at facilities:
- Rehabilitation doctors
- Physiotherapists
- Occupational therapists
- Speech language therapists
- Prosthetists/orthotists
- Psychologists
- Other personnel
If these figures are already collected in the existing DHIS2 HMIS system, it is possible to replace the proposed data element and all its occurences with the existing element in the system. Please refer to the installation guide for information on additional configuration of rehabilitation occupational groups data elements and indicators.

The organisation unit level for collection of population data may vary from use case to use case. Find more information on the configuration of population and personnel data collection in the installation guide.
Inpatient Report
| Inpatient Report | WjN1YoDtlOd |
|---|---|
| Data set form type | custom |
| Data collection period | monthly |
| Facility types | All facilities with an inpatient ward (not dedicated Rehab ward) reporting on Rehab (Master Facility List) |
This data set uses a custom html data entry form that contains four tables:
Rehabilitation cases - Total number of inpatients receiving rehabilitation services at inpatient wards that are not dedicated rehabilitation wards and the disaggregation of these cases by age, sex and health condition groups (HCG) that include musculoskeletal, neurological, mental, sensory, cardiovascular, cancer and respiratory HCGs.

Rehabilitation uptake - Total number of sessions provided to inpatients at non-rehabilitation wards and the disaggregation by HCGs

Rehabilitation facility-based uptake - Number of sessions provided by various rehabilitation occupational groups (rehabilitation doctors, physiotherapists, occupational therapists, speech language therapists, prosthetists/orthotists, psychologists, other personnel)

Assistive products (AP) - Number of assistive products provided to patients disaggregated by age (0-4, 5-17, 18+) and AP groups (mobility, vision, hearing, cognition, communication, self-care) and waiting days for assistive product provision

Rehab Ward Report
| Rehab Ward Report | tP8et8TNWgF |
|---|---|
| Data set form type | custom |
| Data collection period | monthly |
| Facility types | All facilities with a dedicated rehabilitation inpatient ward reporting on Rehab (Master Facility List) |
This data set uses a custom html data entry form that contains six tables:
Rehabilitation cases - Total number of inpatients receiving Rehabilitation services at rehab ward and the disaggregation of these cases by age, sex and health condition groups (HCG) that include musculoskeletal, neurological, mental, sensory, cardiovascular, cancer and respiratory HCGs.
Rehabilitation uptake - Total number of sessions provided to inpatients and the disaggregation by HCGs
Rehabilitation facility-based uptake - Number of sessions provided by various rehabilitation occupational groups (rehabilitation doctors, physiotherapists, occupational therapists, speech language therapists, prosthetists/orthotists, psychologists, other personnel)
Rehabilitation referral - Total number of new cases accessing the facility during the reporting month and number of referrals disaggregated by assistive product provision and other rehabilitation services.

Assistive products (AP) Number of provided assistive products disaggregated by age (0-4, 5-17, 18+) and AP groups (mobility, vision, hearing, cognition, communication, self-care) and waiting days for assistive product provision
Rehabilitation stay Total number of new cases during reporting month, disaggregated by health conditions (HC) that include SCI, TBI, burns, major multiple trauma, amputation and stroke; number of new cases with a comprehensive individualized care plan; length of stay for discharged cases, number of discharged cases, average functioning score for discharged cases at admission and discharge disaggregated by HCs.

Outpatient Report
| Outpatient Report | zInFVXb98JD |
|---|---|
| Data set form type | custom |
| Data collection period | monthly |
| Facility types | All facilities with an outpatient department reporting on Rehab (Master Facility List) |
This data set uses a custom html data entry form that contains six tables:
Rehabilitation cases - Total number of outpatients receiving Rehabilitation services at the facility and the disaggregation of these cases by age, sex and health condition groups (HCG) that include musculoskeletal, neurological, mental, sensory, cardiovascular, cancer and respiratory HCGs.
Rehabilitation uptake - Total number of sessions provided to outpatients and the disaggregation by HCGs
Rehabilitation referral - Total number of new cases accessing the facility during the reporting month and number of referrals disaggregated by assistive product provision and other rehabilitation services.

Rehabilitation facility-based uptake - Number of sessions provided by various rehabilitation occupational groups (rehabilitation doctors, physiotherapists, occupational therapists, speech language therapists, prosthetists/orthotists, psychologists, other personnel), number of new cases (first visits) disaggregated by rehabilitation occupational groups and the total number of waiting days for the first session

Assistive products (AP) - Number of assistive products provided to patients disaggregated by age (0-4, 5-17, 18+) and AP groups (mobility, vision, hearing, cognition, communication, self-care) and waiting days for assistive product provision
Outreach program uptake - Number of outreach sessions provided for clients disaggregated by age (0-4, 5-17, 18+) and sex

Organisation unit groups
The Rehabilitation package operates with a set of predefined organisation unit groups. The purpose of these groups is to:
- help the implementers configure the package after importing it into a new or existing DHIS2 instance
- assign the rehabilitation data sets to the relevant organisation unit groups
- utilize the preconfigured dashboards for analysis purposes.
The predifined organisation unit groups are listed in the table below:
| Name | UID | Description | Purpose |
|---|---|---|---|
| REHAB - Master Facility List | Uvefj6bDfzo | Includes all facilities reporting on rehabilitation | Data set assignment, analytics |
| PHC | aT5pkgRLbw5 | Includes all primary health care facilities | Analytics |
| PHC facilities with a mandate to allocate rehabilitation workers | JCgLXxVGcRS | Includes all primary healthcare facilities with a mandate to allocate rehabilitation workers | Analytics |
| REHAB - PHC | bbsxlCu3Vya | Includes all primary health care facilities reporting on rehabilitation | Analytics |
| SHC | RbJ4hRSGQaH | Includes all secondary health care Facilities | Analytics |
| REHAB - SHC | wZJCB2cj9jg | Includes all secondary health care facilities reporting on rehabilitation | Analytics |
| THC | dV8Ec2zJrze | Includes all tertiary Health Care Facilities | Analytics |
| REHAB - THC | Re0iJ3vtBzE | Includes all tertiary health care facilities reporting on rehabilitation | Analytics |
| Rehab inpatient ward | AGK6oOK4ncb | Includes all facilities with a dedicated rehabilitation ward | Analytics |
The Master Facility List for rehabilitation includes those facilities that have a mandate to report on rehabilitation; these commonly include facilities that have rehabilitation workforce, but also facilities that may be providing rehabilitation services/are expected to provide rehabilitation services delivered by non-rehabilitation workforce through task sharing (often primary care facilities).
The Rehab PHC organisation unit group can be further divided into district hospitals and health centres if such disaggregation is relevant for the country.
More information on the configuration of the organisation unit groups, please refer to the Rehabilitation package installation guide
Indicators
The configuration of indicators included in the Rehabilitation package is described in more detail in the Rehabilitation package installation guide
Validation rules
To maintain data quality during data collection, the package includes a set of validation rules for the outpatient, inpatient and the Rehab Ward report datasets.
The configuration of these validation rules is described in more detail in the Rehabilitation package installation guide
Predictors
The Rehabilitation package includes a set of predictors that are used to produce data values for rehabilitation occupational groups, rehabilitation master facility list and rehabilitation package availability.
Dashboards
The Rehabilitation module includes 7 dashboards described below.
REHAB.01 - Input / Rehabilitation input data
Purpose: The two indicators rehabilitation bed density and personnel density are selected to represent this category as they provide basic information about the availability of core resources needed for essential rehabilitation service provision. They indirectly assess the quality of the rehabilitation service delivery system through the skills set of human resources available in the facilities. Apart from facility program managers, this information is also part of the health system information that health system managers need for the purpose of monitoring, planning and coordination: they need to know whether the rehabilitation beds and health care workers are rightly distributed across health facilities and across programs in order to meet the needs of the target populations.
01.01 - Bed and overall personnel density, (sub)national, last year

01.02 - Personnel density for different occupational groups (sub)national, last year

01.03 - Time trend of bed density, (sub)national, last 5 years

01.04 - Timeline of personnel density per occupational group, (sub)national, last 5 years

01.05 - Map of facilities and number of rehabilitation personnel, last year

01.06 - Number of rehab personnel per occupational group, by administrative levels, national, last year

01.07.01 - Facilities (%) reporting on rehab (MFL) per occupational group, PHC level, national, last 5 years

01.07.02 - Facilities (%) reporting on rehab (MFL) per occupational group, SHC level, national, last 5 years

01.07.03 - Facilities (%) reporting on rehab (MFL) per occupational group, THC level, national, last 5 years

REHAB.02 - Output / Rehabilitation-specific service availability
Purpose: WHO recommends the availability of an Essential Package (EP) for rehabilitation at Primary Health Care (PHC) level for the achievement of Universal Health Coverage (UHC). This indicator measures the percentage of PHC facilities offering 1 or more essential recommended packages (with one as a minimal requirement) and provides information on the status of the implementation of this recommendation in countries. The indicator will list all facilities offering at least 1 of the selected packages, while countries can disaggregate further on the types of essential packages.
02.01 - Geographical distribution of PHC facilities (%) offering an EP, (sub)national, last year

02.02 - Timeline of PHC facilities (%) offering an EP, (sub)national, last 5 years

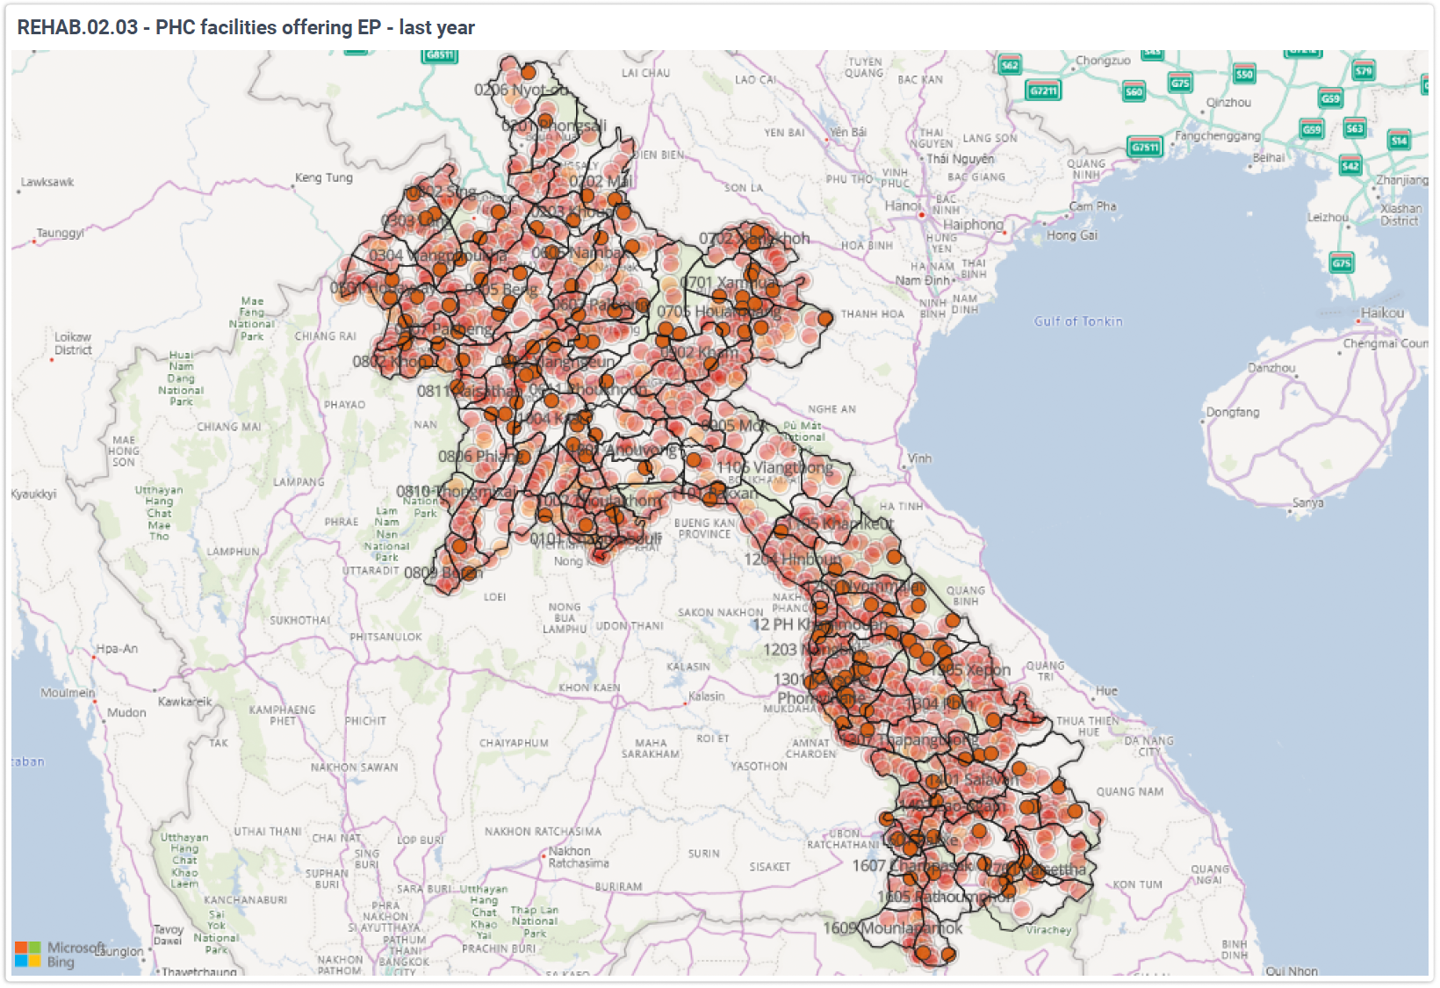
02.03 - Map of PHC facilities offering EP and district outpatient utilization data, last year
02.04 - Number of new outpatients accessing PHCs and district hospitals, by districts, last 5 years

02.05 - Percentage of PHC facilities offering an EP, per EP type, (sub)national, last year

REHAB.03 - Output / Rehabilitation service utilization
Purpose: Rehabilitation service utilization is indicative for rehabilitation accessibility. This part of the indicator set measures the number of rehabilitation sessions and new clients by preset health condition group, the number of assistive products issued, and the number of rehabilitation sessions provided through outreach programs.
03.01 - Facility-based rehabilitation uptake: in- and outpatient, (sub)national, last quarter (user organisation unit)

03.01.01 - Map of facility-based inpatient rehabilitation uptake, last year (user organisation unit)

03.01.02 - Map of facility-based outpatient rehabilitation uptake, last year (user organisation unit)

03.02 - Rehabilitation uptake and service utilization, total, (sub)national, last quarter (user organisation unit)

03.03.01 - Rehabilitation uptake and service utilization for selected health condition group, (sub)national, last quarter

03.04 - Rehabilitation uptake and service utilization, by health condition group, last quarter (user organisation unit)

03.05.01 - Rehabilitation utilization for specific health condition group per geo region, by age group, last quarter (user organisation unit)

03.06 - Rehabilitation utilization per health condition group, (sub)national, last quarter (user organisation unit)

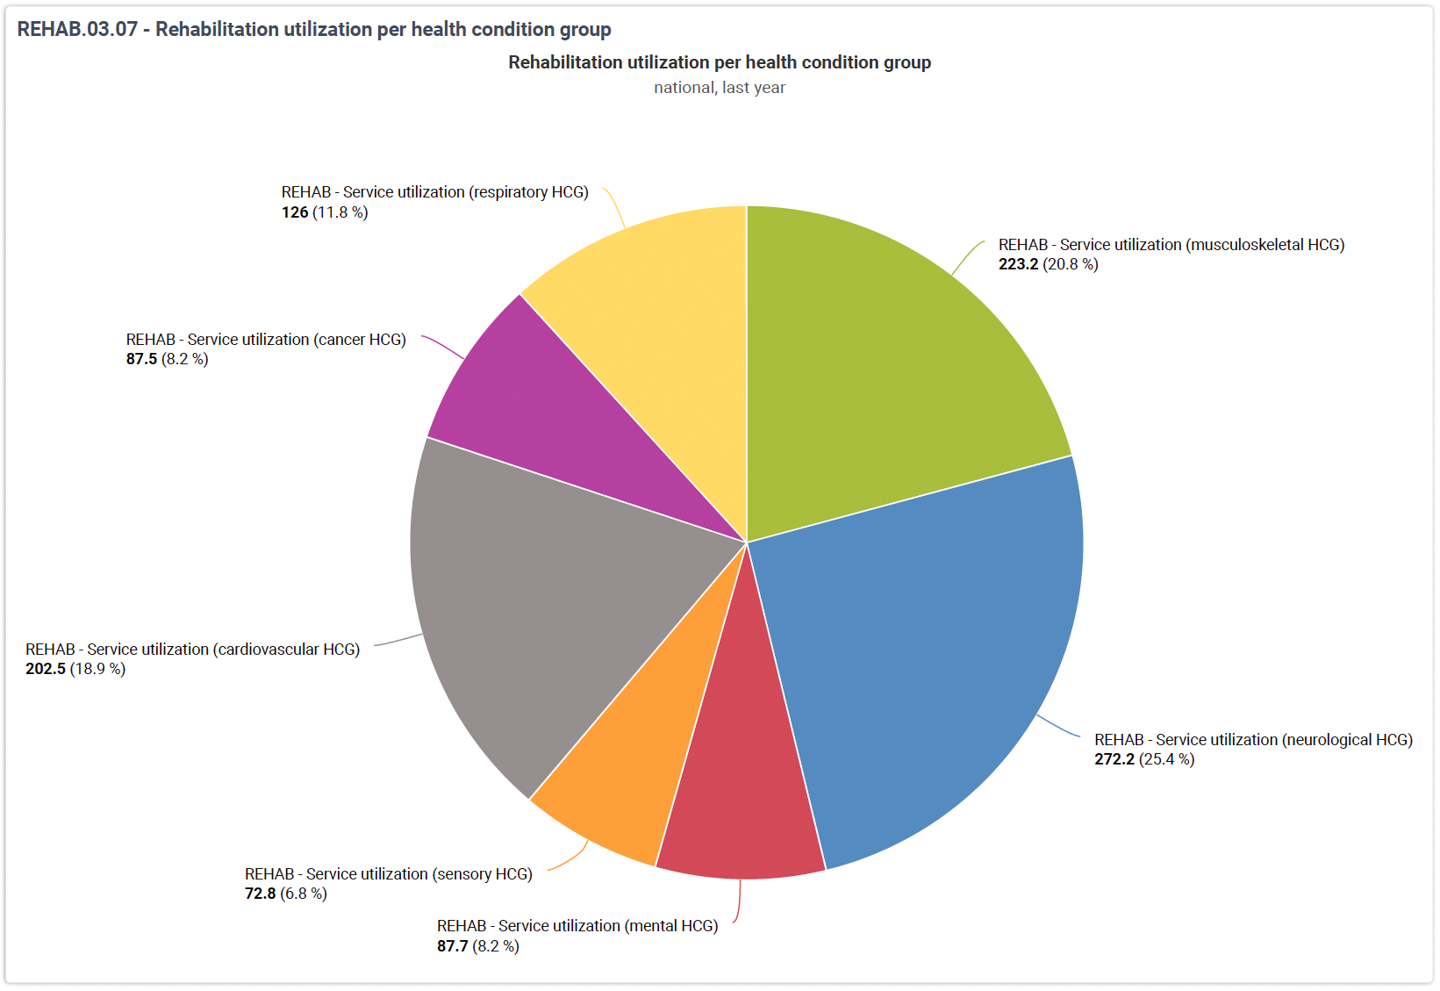
03.07 - Rehabilitation utilization per health condition group, national, last year (user organisation unit)
03.08 - Map of service utilization and personnel density, by districts, (sub)national, last year

03.09 - AP uptake for in- and outpatients per APL category, (sub)national, last quarter (user organisation unit)

03.10 - Outreach program uptake per age group, (sub)national, last quarter (user organisation unit)

03.11 - Timeline of facility-based uptake per health condition group, national, last 5 years (user organisation unit)

03.12 - Rehabilitation uptake and personnel availability, last year (user organisation unit)

REHAB.04 - Output / Rehabilitation service quality
Purpose: Measures of quality and services outcome for dedicated inpatient rehabilitation are particularly interesting for managers. An individualised care plan contributes to better rehabilitation outcomes for clients, and the length of a rehabilitation stay informs assessment of effectiveness and efficiency. Scoring the functioning change over the rehabilitation episode produces a measure of the outcome of the rehabilitation episode. A gain in functioning reflects an increased ability of independent living and societal participation, which is the overall aim of rehabilitation.
04.01 - Timeline of patients (%) with individualised care plan, by hospital with dedicated ward, last 6 months (user organisation unit)

04.02.01 - Timeline of LoS for a specific health condition, by hospital with dedicated ward, last 5 years (user organisation unit)

04.03 - Functioning change and LoS by health condition, last 6 months (user organisation unit)

04.04.01 - Functioning change and LoS for a specific health condition, by hospital with dedicated ward, last 6 months (user organisation unit)

04.05.01 - Timeline of functioning change and LoS for a specific health condition, last 5 years (user organisation unit)

REHAB.05 - Outcome / Service coverage
Purpose: Coverage is measured through the percentage of people with acute and complex rehabilitation needs who access adequately delivered quality rehabilitation services. Good clinical practice prescribes inpatient multi-disciplinary rehabilitation in a dedicated rehabilitation ward for the effective rehabilitation of a group of health conditions with complex rehabilitation needs. The choice of the health condition to be measured needs to be based on national priorities and the availability of the denominator. In most countries the data source for the denominator (estimated number of people in the country with a defined health condition) will need to be established. It could be a national estimate from a population-based survey or ICD coding. Countries may also make use of the catchment population and apply prevalence estimates for the region to calculate the denominator. For reasons of the availability of the denominator, coverage will only be captured at (sub)national level. If the denominator is unavailable, the analyst can still make use of the "Utilization of people with acute and complex needs" indicator.
05.01 - Coverage, by health condition, national, last year

05.02.01 - Map of specialised facilities + accessibility for people with acute and complex needs for a specific health condition + bed density data, last year

05.03 - Accessibility for people with acute and complex needs, by health condition, (sub)national, last 6 months (user organisation unit)

05.04 - Timeline of coverage, by health condition, (sub)national, last 5 years

05.05 - Timeline of accessibility for people with acute and complex needs, by health condition, (sub)national, last 5 years (user organisation unit)

REHAB.06 - Outcome / Functioning change
06.01 - Functioning change per health condition, by hospital with dedicated ward, last 6 months (user organisation unit)

06.02.01 - Timeline of functioning change for a specific health condition, by hospital with dedicated ward, last 5 years (user organisation unit)

06.03.01 - Timeline of functioning change (including pre and post scores) for a specific health condition at selected hospital with dedicated ward, last 5 years (user organisation unit)

REHAB.07 - Continuum of care
Purpose: This section provides information on the rehabilitation sector performance. Rehabilitation is commonly part of a continuum of care and a strong continuum results in better health outcomes. Both rehabilitation referral practice and waiting time are indicative for effective use of the continuum of care. Well-functioning referral processes happen in both directions across the levels of health care, and referrals need to be documented per case to demonstrate effective use of referral process mechanisms. Timely delivery of rehabilitation contributes to its effectiveness and the overall quality of care.
07.01 - Timeline of waiting time for AP provision (outpatients) per APL category, for selected subnational region, last 5 years (user organisation unit)

07.02 - Timeline of rehabilitation referrals and rehabilitation waiting time per profession type, for selected administrative level, (sub)national, last 5 years (user organisation unit)

07.03 - Rehabilitation waiting time per occupational group, by administrative level, for selected subnational region, last 6 months (user organisation unit)

07.04 - Number of referrals and outpatients, by administrative level, by geo region, last quarter (user organisation unit)

07.05 - Referral totals and proportions per administrative level, last 6 months (user organisation unit)

07.06 - Rehab referrals (%) for administrative levels, by subnational region, last 6 months
Note
- All visualizations that are labeled with (user organisation unit) may be compiled into an additional dashboard for facility-level analysis.
- Visualizations 03.03.01, 03.05.01, 04.02.01, 04.04.01, 04.05.01, 05.02.01, 06.02.01 and 06.03.01 are configured for a specific health condition group / health condition. Configure visualizations for other health condition groups / help conditions based on the provided examples.