Web Vitals is a Google initiative that seeks to define a common set of quality signals to measure user experience across the web. One of the initiative’s goals is to make it easier for website owners to measure site performance without extensive experience in performance engineering.

Here, we take a look at Google’s Web Vitals initiative, explore the Core Web Vitals in depth, and look at how we can measure and optimize the Core Web Vitals in single-page apps (SPAs).
Google’s Web Vitals initiative consists of:
There are currently five Web Vitals:
CLS, FID, and LCP are considered Core Web Vitals. A Core Web Vital is intended to apply to all webpages irrespective of how those webpages are built. It’s an ambitious goal, considering all the different types of webpages out there. We’ll take a closer look at how each Core Web Vital applies to single-page apps (SPAs).
Despite their relatively short lifespan, a variety of tools and packages can already be used to measure Core Web Vitals — and the list keeps growing. Here are a few of the more common tools:
The web-vitals npm package has recently been added to some web app scaffolders by default. For example, if you’ve got a React app made with a recent version of Create React App, then the web-vitals package is already included in your solution.
Otherwise, head over to the web-vitals package page on npm, where there are detailed instructions on how to install and configure the package in your application.
As we look more closely at each of the Core Web Vitals, we will also use a few of these tools in action. We’ll use the Northern Getaway Backyard Solutions sample SPA to simulate situations that result in weak Web Vitals. The source code for the sample app is available on GitHub.
The Northern Getaway Backyard Solutions demo app was generated using Create React App, so no additional web-vitals package setup was required. For convenience, Core Web Vitals scores are displayed at the top of the app as they become available:

Keep in mind that Web Vitals scores will differ between users due to variables like network connection speed, device type, screen resolution, browser window size, and more. If you’re following along with the demo app opened on your device, you should expect Web Vitals scores to differ, but the results should nonetheless be similar.
Cumulative Layout Shift quantifies the visual stability of a webpage. Perhaps the most relatable example of layout shift involves on-page advertisements. Most users have found themselves reading content on a webpage only to have the text shift down and sometimes even off screen as advertisements are loaded and inserted into the page. This sort of uncomfortable user experience is what CLS attempts to measure.
The Layout Stability API is a specification that defines how CLS is measured and what is considered to be a layout shift. According to this specification, not all layout shifts count towards the CLS score. For example, CSS transforms or a user scrolling a page do not affect the CLS score.
CLS scores start at 0. The original CLS scoring algorithm increased CLS as elements shifted in the viewport until the next page load event. This algorithm could have led to unreasonably high CLS scores for long-lived pages like single-page apps. Imagine a single-page app with client-side routing. Each route change displays new content, which is the expected behavior, yet the CLS score continually increases.
In response, on 7 April 2021, Google announced a modification to the CLS scoring algorithm to provide better scoring for long-lived pages. With this modification, layout shift will be grouped into 5s (maximum) windows, with a 1s gap between each window. Each layout shift window is measured per the Layout Stability API. On the subsequent page load event, the window with the highest CLS score becomes the previous page’s CLS score.
Let’s take a look at a layout shift example. Navigate to the Our Work page of the Northern Getaway Backyard Solutions demo app. Once the page has fully loaded, reload the page to view the CLS score. Remember that CLS can only be measured after the next page load event has occurred. The CLS score you see now reflects the layout shift that occurred on the previous page.
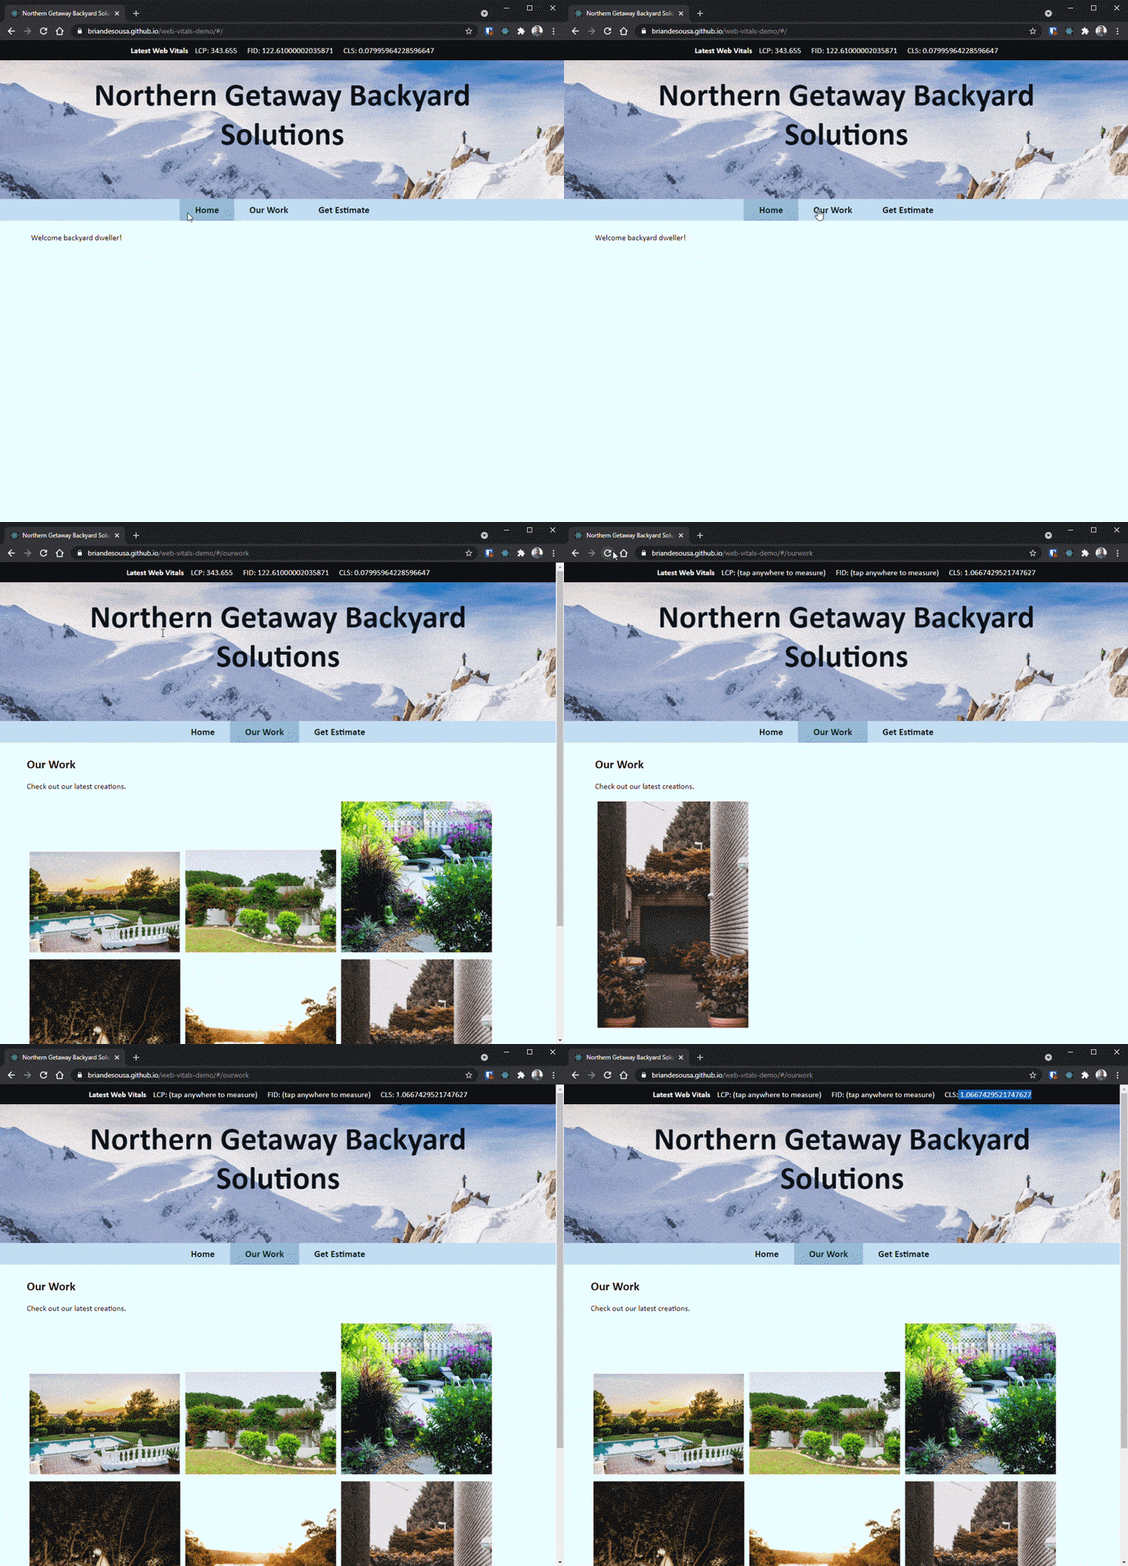
The Our Work page simulates loading images asynchronously on a slow internet connection. Image dimensions have not been specified in the code. As each image loads, previously loaded images move around within the viewport, which can be classified as layout shift. Keep in mind that the CLS score will vary depending on how much of the page is visible in the viewport.
The resultant CLS score is approximately 1.06, which is not good — in fact, according to Google’s CLS score scale, anything over 0.25 is considered poor.
So how do you improve the CLS score of the Our Work page? The solution is quite simple in this case. If you define a width and height on each image, the browser will know how much space to allocate for the image. The browser is able to determine exactly where each image will appear on screen before it loads.
We looked at a single example of layout shift in the previous example, but there are many other sources of layout shift. Here are a few common sources and solutions:
| Source of layout shift | Solutions |
|---|---|
| An image or video with unknown dimensions |
|
| A font that renders larger or smaller than the fallback font |
|
| A third-party ad or widget that dynamically resizes itself |
|
Largest Contentful Paint measures the load time of a page’s main content. The idea is that a user perceives how quickly a webpage loads by how quickly the page’s main content becomes visible. Once the main content is visible, the user feels like the page has loaded even though smaller peripheral elements may still be loading.
The page’s main content is determined by identifying the largest image or text block visible in the browser viewport. The block could be an image, a video, a block element containing text, or even a background image loaded via CSS.
The Largest Contentful Paint API defines a full list of allowable elements. This list is intentionally short and concise to keep the metric simple. The API also specifies how an element’s size is calculated, taking into account elements that are only partially visible in the viewport and other similar nuances.
Let’s take a look at an LCP example. Navigate to the Home page of the Northern Getaway Backyard Solutions demo app. After about 4s, the page should be fully loaded. Tap or click anywhere on the screen to force the browser to report LCP. After that first interaction with the page, it no longer makes sense to continue to track and report on LCP since subsequent interactions could intentionally alter what is visible on the page.
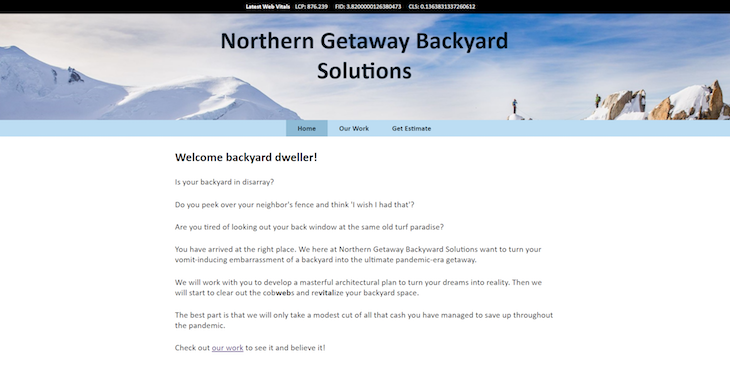
The LCP score came in at approximately 0.9s. Keep in mind that LCP scores will vary based on network speed and how large the browser viewport is. In this case, the browser was fully expanded on a laptop screen with 1920×1080 resolution.
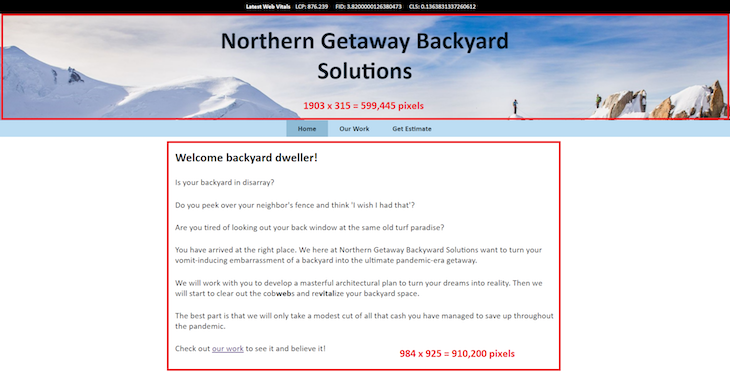
Something’s not right here! The Home page is specifically designed to load the main block of text after 4s, yet the LCP score is 0.9s. On the surface, it seems that the block of text is the largest block on screen, and therefore, the LCP score should be 4,000 (4s) or higher. Strictly based on measurements, the main text block is certainly larger than the header:
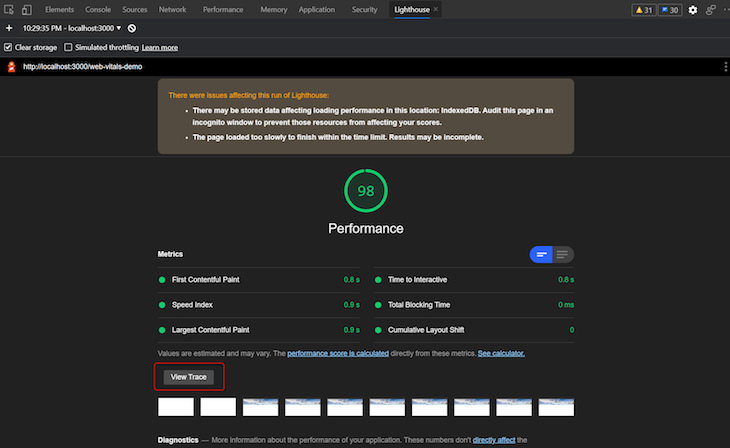
We can use Lighthouse in Chrome DevTools to see what’s displayed on screen when LCP is reported. Open the demo app and DevTools in Chrome. Follow these steps to generate a Lighthouse report with Web Vitals:

Once the report has been generated, click on the View Trace button.
Scroll horizontally on the Timings swim lane until you locate the LCP marker. Expand the Frames swim lane to see a screenshot of the page at the moment the LCP was reported.
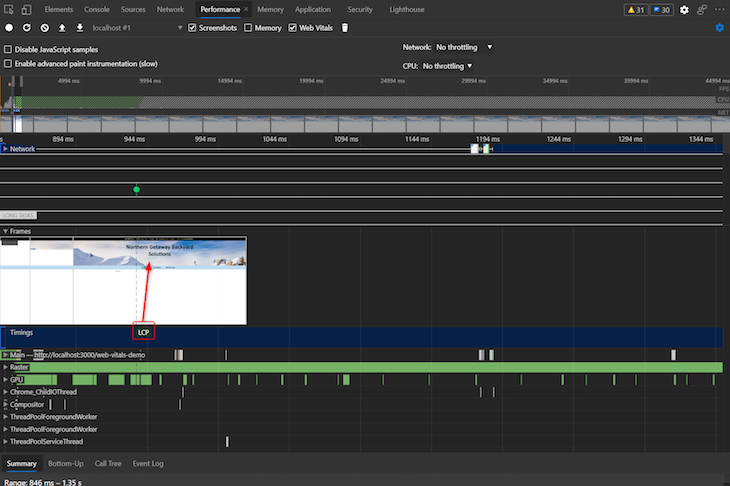
The screenshots prior to and after the LCP marker suggest that the header block is what’s driving the LCP score. We can prove this by temporarily updating the app’s source code to hide the header and then rerun the Lighthouse report.
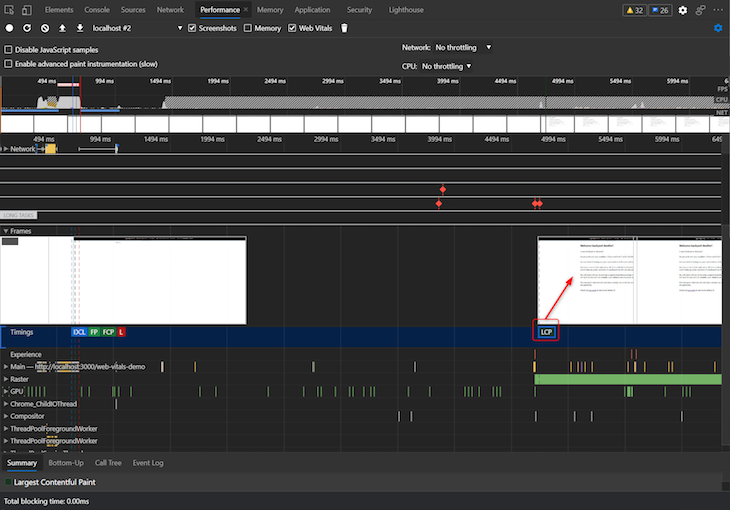
The LCP score is now roughly 4.5s, or roughly the amount of time that the main text block takes to appear on screen. Let’s look at the source code for the main text block:
<div className={`${contentLoaded ? '' : 'hidden'}`}>
  <h2>Welcome backyard dweller!</h2>
  <p>Is your backyard in disarray?</p>
  <p>Do you peek over your neighbor's fence and think 'I wish I had that'?</p>
  <p>Are you tired of looking out your back window at the same old turf paradise?</p>
  <p>You have arrived at the right place. We here at Northern Getaway Backyard Solutions want to turn your vomit-inducing embarrassment of a backyard into the ultimate pandemic-era getaway.</p>
  <p>We will work with you to develop a masterful architectural plan to turn your dreams into reality. Then we will start to clear out the cob<strong>web</strong>s and re<strong>vital</strong>ize your backyard space.</p>
  <p>The best part is that we will only take a modest cut of all that cash you have managed to save up throughout the pandemic.</p>
  <p>Check out <a href="/#/ourwork">our work</a> to see it and believe it!</p>
</div>
If you recall, LCP is based on the how long it takes for the largest block-level element to be rendered in the viewport. In the sample source code, each of the paragraph elements are block-level elements. LCP is actually being reported due to the rendering of one of those paragraph elements, whichever is largest. It’s also important to note that the LCP API does not include padding or margins in its calculations.
Just like other Web Vitals, LCP is only measured initially when the page is loaded. Consider a single-page app with client-side routing and asynchronous content loading. The first route in the application may load very quickly.
As soon as the user interacts with the webpage — to navigate to a different route, for instance — the LCP score is reported. At this point, Web Vitals will not track LCP for subsequent client-side route changes. Depending on how the app is designed, LCP may offer limited value for measuring user experience.
The Home page example simulated slow-loading content. In a real-world scenario, this content could be coming from a backend API that is frequently under heavy load and unable to respond within a reasonable amount of time. There are many possible fixes for this scenario, including:
First Input Delay measures how quickly a page responds to a user’s first interaction. Other Web Vitals tend to focus on how quickly a user sees something on the screen, but this metric focuses on the initial interaction with the page and what the user perceives. It’s great if your page loads and renders extremely fast, but the UX may still be poor if users are unable to immediately interact with the page.
FID can be difficult to understand at first. It measures the time between when a user first clicks or taps on a page to the time that the browser is actually able to start handling the resultant event — but not how long it takes for the app to do what it must when that event is raised.
For example, let’s assume a user’s first interaction with a webpage is clicking a button. The browser is unable to respond to the click event for 100ms because its main thread is busy executing JavaScript initiated on page load. Once the browser is able to respond, the click event takes an additional 200ms to complete. The reported FID would be 100ms.
Let’s take a look at some sample FID scores on the Northern Getaway Backyard Solutions demo app. Navigate to the Get Estimate page. Click on the Estimate Type dropdown to force FID to be reported.
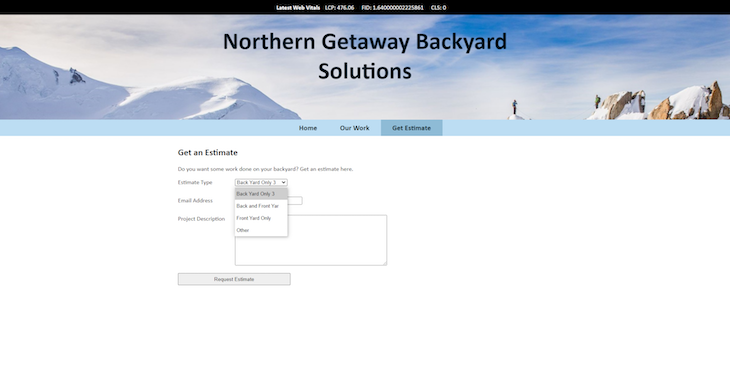
The FID score is approximately 1.6ms, which is far lower than the ≥100ms score Google considers poor. This is about as good as it gets. The Get Estimate page doesn’t really have much happening behind the scenes; the user can interact with the form nearly instantaneously once it becomes visible in the browser.
Let’s add the following CPU-intensive event handler to the click event on the Email Address field. Do you think the FID score will be affected?
  function doSomethingSlow() {
    console.time('onClick event handler');
    const baseNumber = 12;
    let result = 0;
    for (var i = Math.pow(baseNumber, 7); i >= 0; i--) {
      result += Math.atan(i) * Math.tan(i);
    };
    console.log(`result was ${result}`);
    console.timeEnd('onClick event handler');
  };
Reload the Get Estimate page. Before clicking on the page, open Chrome DevTools so that the console is visible. Click on the Email Address text box. The browser will lock up for 4–5s while the CPU-intensive function executes. Once the function completes, the FID score will appear at the top of the screen, and the function result will appear in the DevTools console.
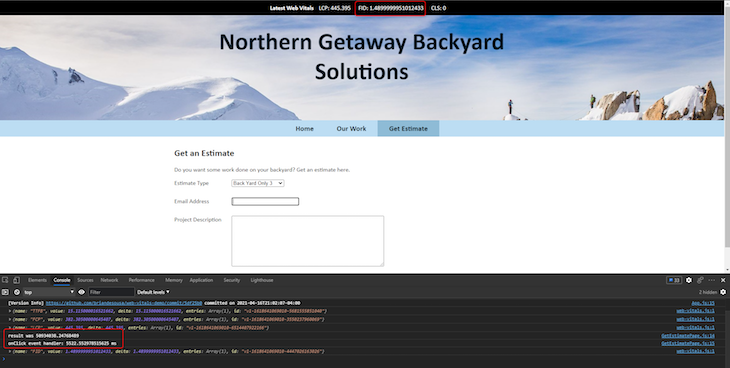
This time, the FID score came in at about 1.49ms, even lower than the 1.6ms from the previous example. This demonstrates that FID does not include the time it takes to execute the event handler itself.
You measure FID scores differently from how you’d measure other Core Web Vitals. LCP and CLS can be measured in a lab environment using a variety of tools, but FID can only be measured in the field with real users.
To measure FID at test time, Google recommends that you look at the Total Blocking Time (TBT) Web Vital instead. Although TBT isn’t the same as FID, it does provide some insight into long tasks that block the main thread for more than 50ms prior to the page being ready for user interaction. Any of these long tasks could result in a poor FID score in the field.
To measure FID in the field, you need to use tools that are capable of accessing data collected from real users who have interacted with the page. Page Speed Insights can pull data from the Chrome User Experience Report to provide an overall FID score for the page. This assumes there have been enough users accessing the page who have also opted in to provide their data to the Chrome User Experience report.
Just like the other Web Vitals, FID is only measured on the first interaction with the page. FID will not identify poor user experiences on subsequent interactions on the page or interactions on subsequent routes in a single-page app that uses client-side routing.
Not being able to interact with elements on screen can be extremely frustrating to users, especially since users may not be able to determine whether the lockup is due to the page itself or their browser or system locking up. Depending on your situation, it might make sense to implement custom FID monitoring on all client-side route changes.
First Input Delay and main thread blocking can be caused by a number of things. Here are a few examples and potential solutions:
The table below summarizes each of the Core Web Vitals.
| Core Web Vital | Definition | How it’s measured |
|---|---|---|
| Cumulative Layout Shift (CLS) | The visual stability of your webpage determined by the amount of layout shift when the page initially loads |
|
| Largest Contentful Paint (LCP) | The amount of time it takes to load the largest element on screen |
|
| First Input Delay (FID) | The amount of time between the user’s first interaction with a page and the browser’s response to that interaction |
|
There are active discussions between the Google Chrome team and SPA developers regarding the applicability of Core Web Vitals to single-page apps. Some of those discussions have already led to changes, particularly the evolution of CLS. Google has also indicated that the Core Web Vitals are expected to evolve over time. We may see new Web Vitals rise to prominence and add to or replace existing Core Web Vitals.
Support for Web Vitals outside of Google tools continues to grow. A quick search for Web Vitals-related packages on npm yielded 27 results at the time of writing. These search results include packages that integrate with some of today’s most popular frontend libraries and frameworks, including React, Vue.js, Nuxt.js, and Gatsby.
Perhaps the biggest hint that Web Vitals are here to stay is the fact that Google is set to include Web Vital metrics in page experience signals that contribute to how Google ranks search results. Google appears to be all in on Web Vitals; this all but guarantees some longevity to this method of measuring user experience.
LogRocket helps software teams fix issues, increase conversions, and drive product engagement. With LogRocket, you can monitor page load times, CPU/memory usage, browser crashes, and React component rendering. You can also see how performance affects conversion rates and engagement.
LogRocket automatically monitors all key Web Vitals and shows you how these metrics impact user experience.
Modernize your frontend performance monitoring — try LogRocket for free.
Would you be interested in joining LogRocket's developer community?
Join LogRocket’s Content Advisory Board. You’ll help inform the type of content we create and get access to exclusive meetups, social accreditation, and swag.
Sign up now
Simplify component interaction and dynamic theming in Vue 3 with defineExpose and for better control and flexibility.

Explore how to integrate TypeScript into a Node.js and Express application, leveraging ts-node, nodemon, and TypeScript path aliases.

es-toolkit is a lightweight, efficient JavaScript utility library, ideal as a modern Lodash alternative for smaller bundles.

The use cases for the ResizeObserver API may not be immediately obvious, so let’s take a look at a few practical examples.
6 Replies to "Core Web Vitals best practices for SPAs"
So much useful information on your article.This is going to help me a lot.Thanks for these very informative posts about google new update.Good Luck for the upcoming update!
Bottom of our heart, your LCP, FCP , Web Vitals concepts are long lasting for our side. and too much helpful for us specially for SEO as well as digital marketing fields. Thnaks a lot for this amazing stuff.
Well known blog from my side because whenever i have a SEO related issue. then this community helping me a lot!
Thanks a lot Mr. Gentleman
Now I Received Notice From Google search console Regarding words Like “Crawl budget exhausted” . and I cant understand more on the same. so please Guide me for the same if possible! Thanks in advance!!
Just Worth to read your web vital blog. but some time i have done all factor related core web vitals. but some times appeared more than 0.4 seconds time out in google search console. any idea?
i have some issue like 302 redirected urls so please help me to get this out issue